International Journal of Marine Science, 2017, Vol.7, No.24, 229-246
240
excellent. It was confirmed through lower mortality rate and 0 percent prevalence rate.
Table 5 Showing effects of treatments on detachment of the trophonts and recovery of fish
Parameter Group
Mean Length
(cm)
Mean Weight
(gm)
Total No. Dose
Duration of
Exposure
Mean Intesity of Infection
skin smear Gill smear prevelance %
First Week
G1
control
(-)
apparently healthy
6.98
7.43
30
-
-
0
0
0%
G2 control
(+)infested
7.68
7.77
30
-
-
12/F
15/ F
90.00%
G3 Treated
7.31
5.13
30
100 ppm 30 min
6/ F
10/ F
53.33%
G4 Treated
8.05
6.33
30
200 ppm 30 min
3/ F
10/ F
43%
Second Week
G1 control (-)
6.98
7.43
30
-
-
0
0
0%
G2 control (+)
7.68
7.77
30
-
-
10/F
18/F
93%
G3 Treated
7.31
5.13
30
100 ppm 30 min
3/F
5/F
27%
G4 Treated
8.05
6.33
30
200 ppm 30 min
2/F
4/F
20%
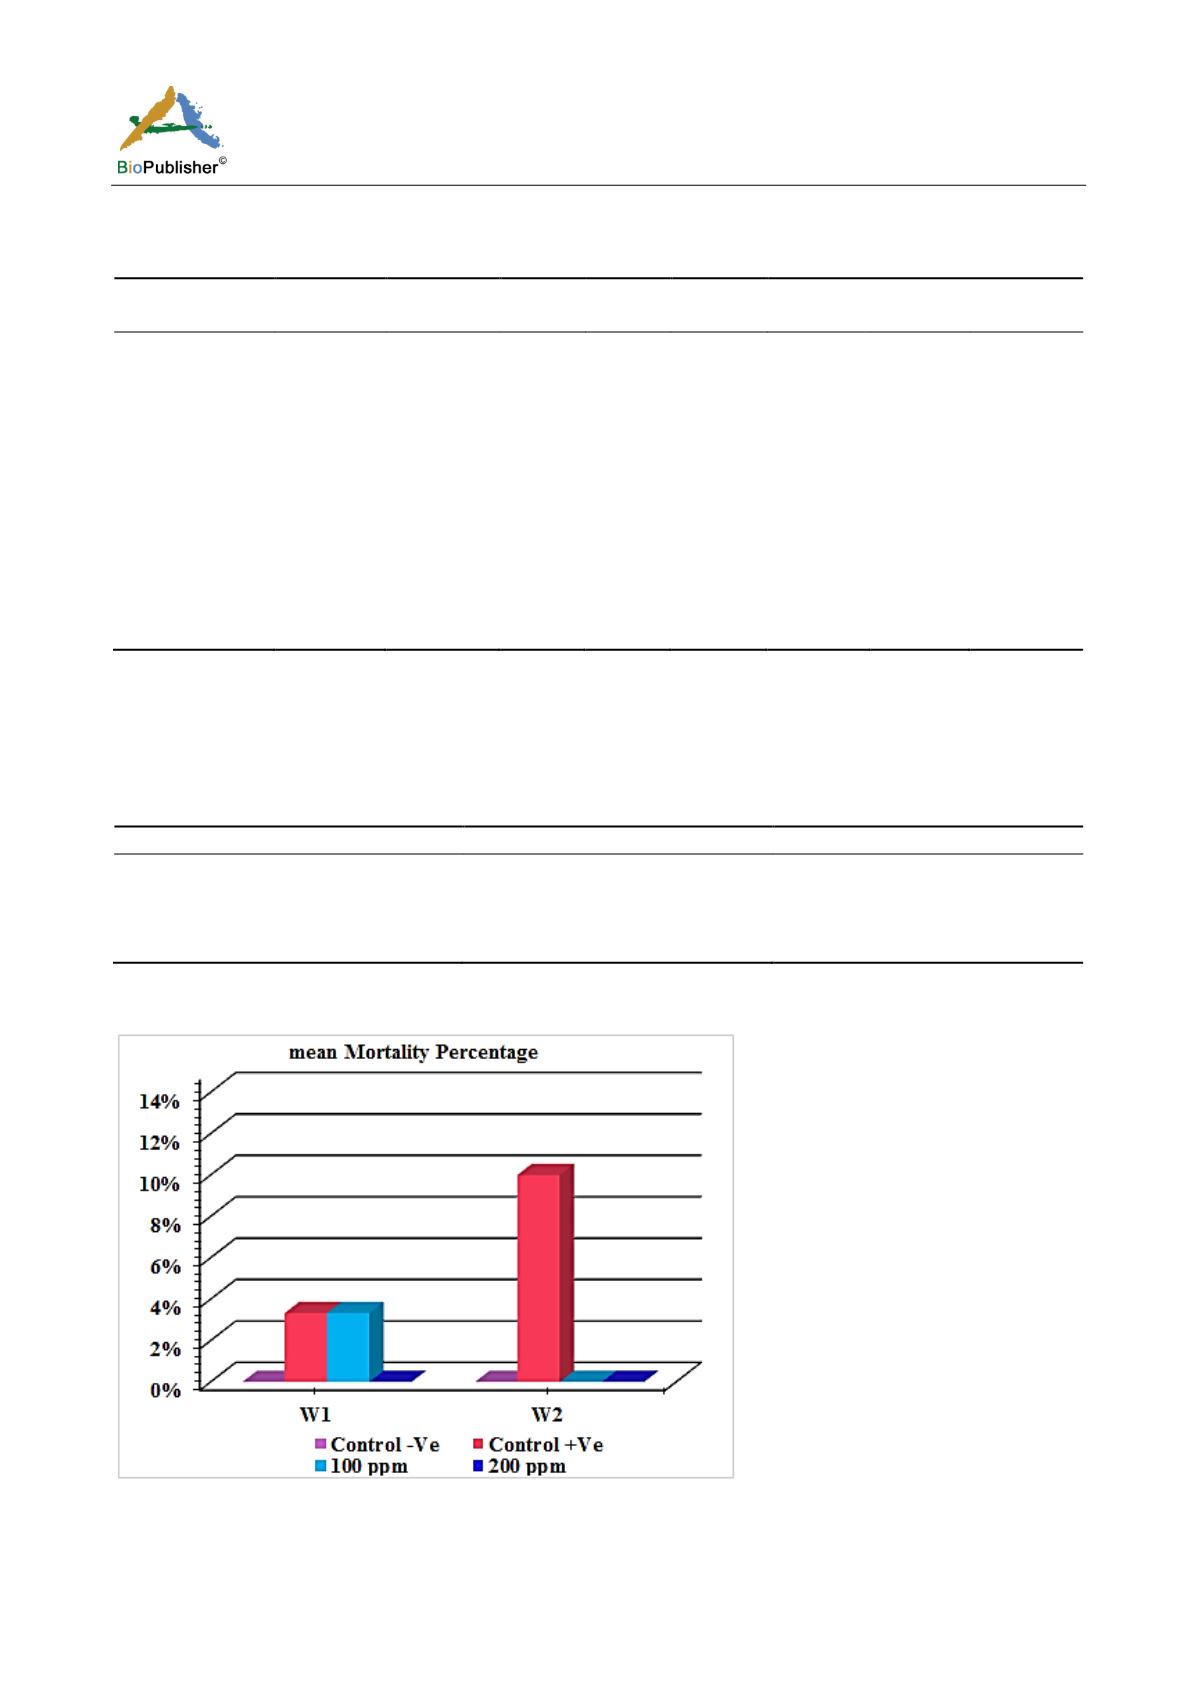
According to Table 6 and Figure 28, there was no significance difference in mean mortality percentage in treated
group with 100 ppm and infested group in 1st week & 2nd week. Also there was no significance difference in
mean mortality percentage between treated groups 100 ppm & 200 ppm. (1% & 0%) respectively in 1
st
week and
in 2
nd
week (0% & 0%) respectively.
Table 6 Comparison of Mortality number and percentage among treated groups No. (%) after (30 min.) treatment (.G: group W week)
Groups
W1
W2
Control –Ve(G1)
0 (0%)
a
0 (0%)
b
Control +Ve(G2)
1 (3.33%)
a
3 (10.0%)
a
100 ppm (G3)
1 (3.33%)
a
0 (0%)
b
200 ppm (G4)
0 (0%)
a
0 (0%)
b
Note: Percents within the same column sharing the same subscript are not significantly different at p< 0.05 in the two-sided test
Z-test. Tests are adjusted for all pairwise comparisons using the Bonferroni correction
Figure 28 Comparison of the mean Mortality number No. and percentage (%) among treated groups after (30 min.) treatment


