International Journal of Marine Science, 2017, Vol.7, No.24, 229-246
241
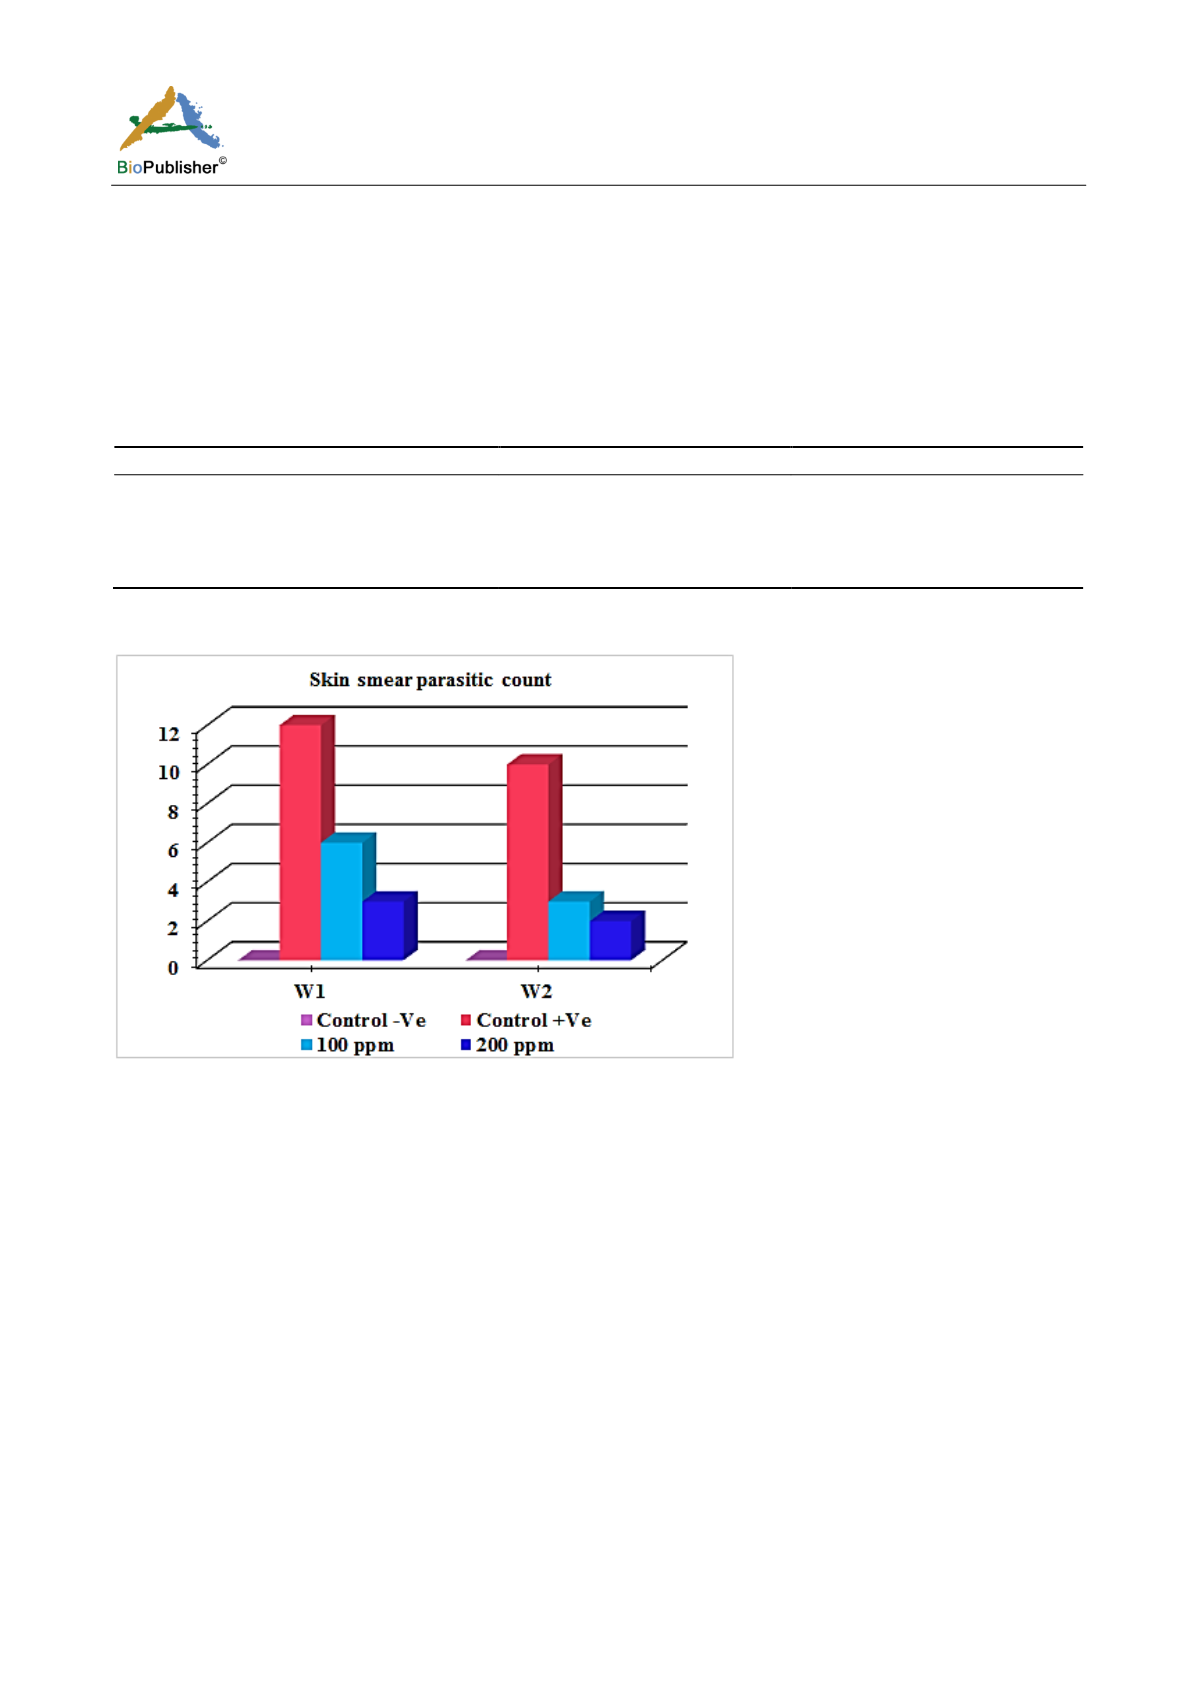
Table 7 and Figure 29 revealed that there was a significant difference in skin smear parasitic count between the
infested groups (G2) that used as a control in the treatment and treated groups (G3 & G4). Skin smear parasitic
count was recorded 12in 1
st
week while 10 in 2
nd
week. while in treated groups G3 with adose 100 ppm the skin
smear parasitic count was recorded 6in 1
st
week & 3in the 2
nd
week and about the treated groups G4 with adose
200ppm the skin smear parasitic count was recorded 3in 1
st
week while 2 in 2
nd
week. It was cleared that there
was no a major significant difference in prevalence rate percentage between the two doses that used in treatments
design in 1st week & 2nd week.
Table 7 Comparison of skin smear parasitic count among treated groups after (30 min.) treatment (G: group; W: week)
Groups
W1
W2
Control –Ve(G1)
-
-
Control +Ve(G2)
12±1.07
a
10±0.91
a
100 ppm (G3)
6±1.11
b
3±0.83
b
200 ppm (G4)
3±1.03
c
2±0.97
b
Note: Means within the same column carrying different superscripts are sig. different at P < 0.05 based on Tukey's Honestly
Significant Difference (Tukey’s HSD)
Figure 29 Comparison of skin smear parasitic count among treated groups after (30 min.) treatment
Table 7, Tabe 8, Figure 29 and Figure 30 were concluded that the mean intensity of infection (skin smear parasitic
count & gill smear parasitic count that the load of infection in gill smear was higher than in skin smear (18&10)
respectively. That means that the primary site of infection and the main target organ of amyloodinium ocellatum
trophont is the gill tissues.
Table 9 and Figure 31 revealed that there was a significant difference in prevalence rate percentage between the
infested groups (G2) that was recorded with a high prevalence % (90.0% in 1
st
week &93.3% in 2
nd
week)
respectively, while the treated groups (G3) with adose100 ppm recorded (53.3% in 1
st
week &26.7%
in 2
nd
week)
respectively, the treated groups (G4) with adose 200 ppm recorded 43.3% in 1
st
week &20.0%
in 2
nd
week)
respectively, also it was cleared that there was no a major significant difference in prevalence rate percentage
between the two doses that used in treatments design, in 1st week & 2nd week.
The infested fishes were exposed to 100 ppm & 200 ppm hydrogen peroxide 20% for thirty minutes. The control
fish were examined and found to have a mean of 18 ±0.93 trophonts per gill biopsy & 10 ±0.91 trophonts per
skin smear. The fish that were to be treated with100ppm showed a mean of 10 ±1.01 trophonts per gill biopsy in
first week & 6 ±1.11 trophonts per skin smear. The fish were retreated with 100 ppm hydrogen peroxide for thirty
minute for another 6 days and the count was down to 5 ±0.93 trophonts per gill biopsy & 3 ±0.83 trophonts per
skin smear. The fish were treated with another dose 200 ppm hydrogen peroxide for thirty minute for 6 days. the


