International Journal of Marine Science, 2017, Vol.7, No.31, 297-307
305
1H-NMR spectrum also showed the presence of methylene protons with the integration of the twenty-four protons
in the area δH 1.29 ppm (24H, m). Proton in this area thought to represent 12 protons methylene (CH2). Signals -
signals that appear in the area δH 5.34 ppm and in the area δH 2.0 ppm suspected as a signal for carbon impurities.
It is seen from the integration of the two pieces of proton signals with very little integration.
2.5.2 Identification with 13C-NMR spectrum
Identification of the isolated compounds with 13C-NMR spectrum, showed ten carbon signals. One signal sp2
carbon in the form of C that appears in the δC 180.5 ppm and allegedly as carbonyl signal. Nine other signals in
the form of C sp3 each - each appear in the δC 29.9; 29.8; 29.6; 29.5; 29.4; 29.3; 24.9; 22.9; and 14.3 ppm.
To clarify the types of carbon atoms that appear in the 13C-NMR spectrum then be identified by DEPT spectrum
135. Identify the DEPT 135 spectrum is clear signal on carbon spectrum whether in the form of metin, methylene,
methyl or having carbon kwartener. DEPT spectrum showed the presence of carbon atoms in the form of C
kwartener in the area δC 180.5 ppm. Methyl carbon signals seen in the area δC 14.3 ppm and the methylene sinyel
to appear in the area δC 34.3; 32.1; 29.8; 29.7; 29.6; 29.5; 29.4; 29.3; ΔC 24.9 and in areas 22, 9 ppm. The results
of the data analysis of 1D NMR spectrum allegedly isolated compounds are a group of fatty acid compounds.
2.5.3 Structure identification with NMR 2D
In the HMQC spectrum (Figure 13) shows that the proton at δH 2.34 area; 1.64 and 0.86 ppm respectively - each
bound to the carbon in the area δC 34.3; 1.64; and 14.3 ppm. HMBC spectrum (Figure 13B) shows a correlation
between the proton at δH 2.34 ppm region with carbon in the area δC 29.3 and 24.9 ppm. HMBC spectrum also
shows that the proton at δH 1.64 ppm region has a correlation with the carbon in the carbon δC 34.3 ppm and 29.3
ppm in the area δc.
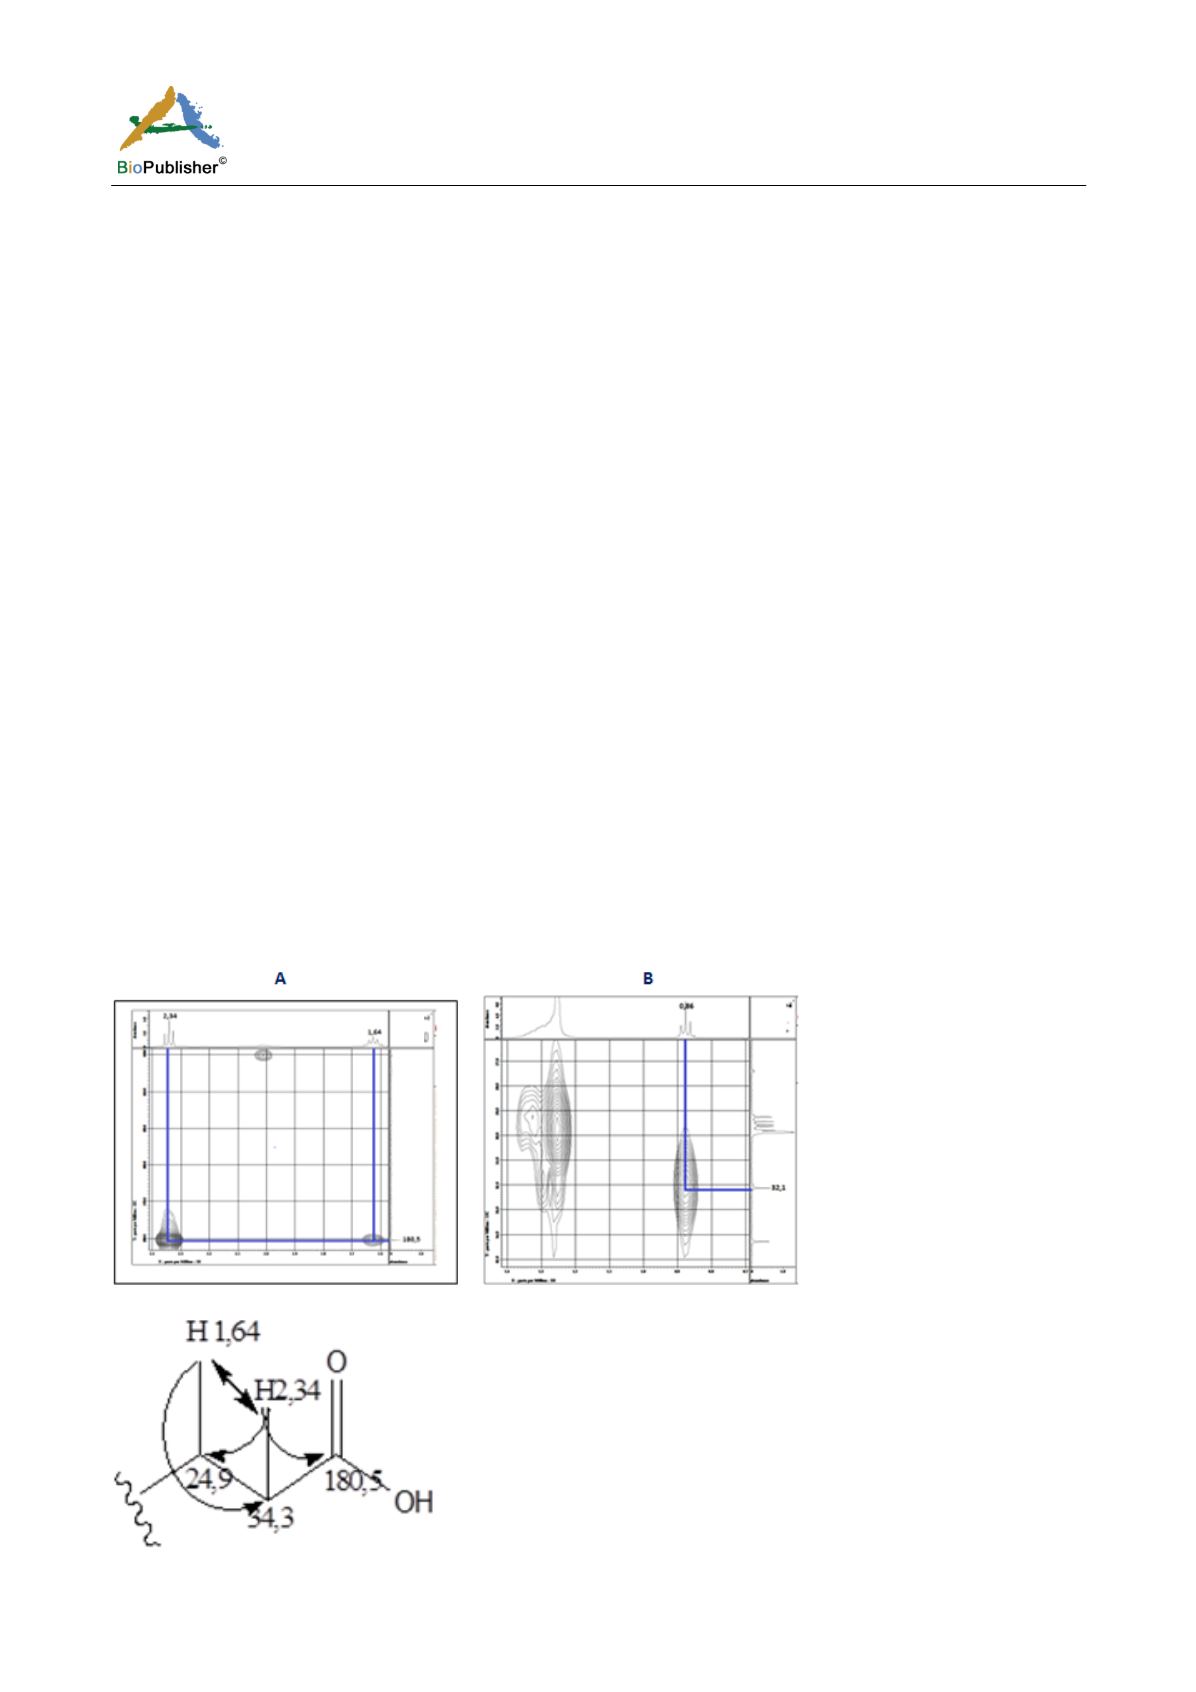
Fragment of HMBC spectrum isolated compounds also showed that the proton at δH 2.34 ppm region and protons
at δH 1.64 ppm region correlated with the carbon in the area δc 180.5 ppm. HMBC spectrum (Figure 14) shown a
correlation between the proton at δH 0.86 ppm region with carbon at 32.1 ppm δc area. HMQC and HMBC total
spectrum isolated compounds are given in Appendix 7 and pieces of the structure of HMBC correlations are given
in Figure 15.
Figure 14 HMBC spectrum fragment (A) area δH 1.6 ppm - 2.4 ppm δH. HMBC spectrum (B) area of 0.7 ppm - 1.4 ppm δH
Figure 15 Pieces of the structure of isolated compounds with HMBC and COSY correlations


