International Journal of Marine Science, 2017, Vol.7, No.31, 297-307
302
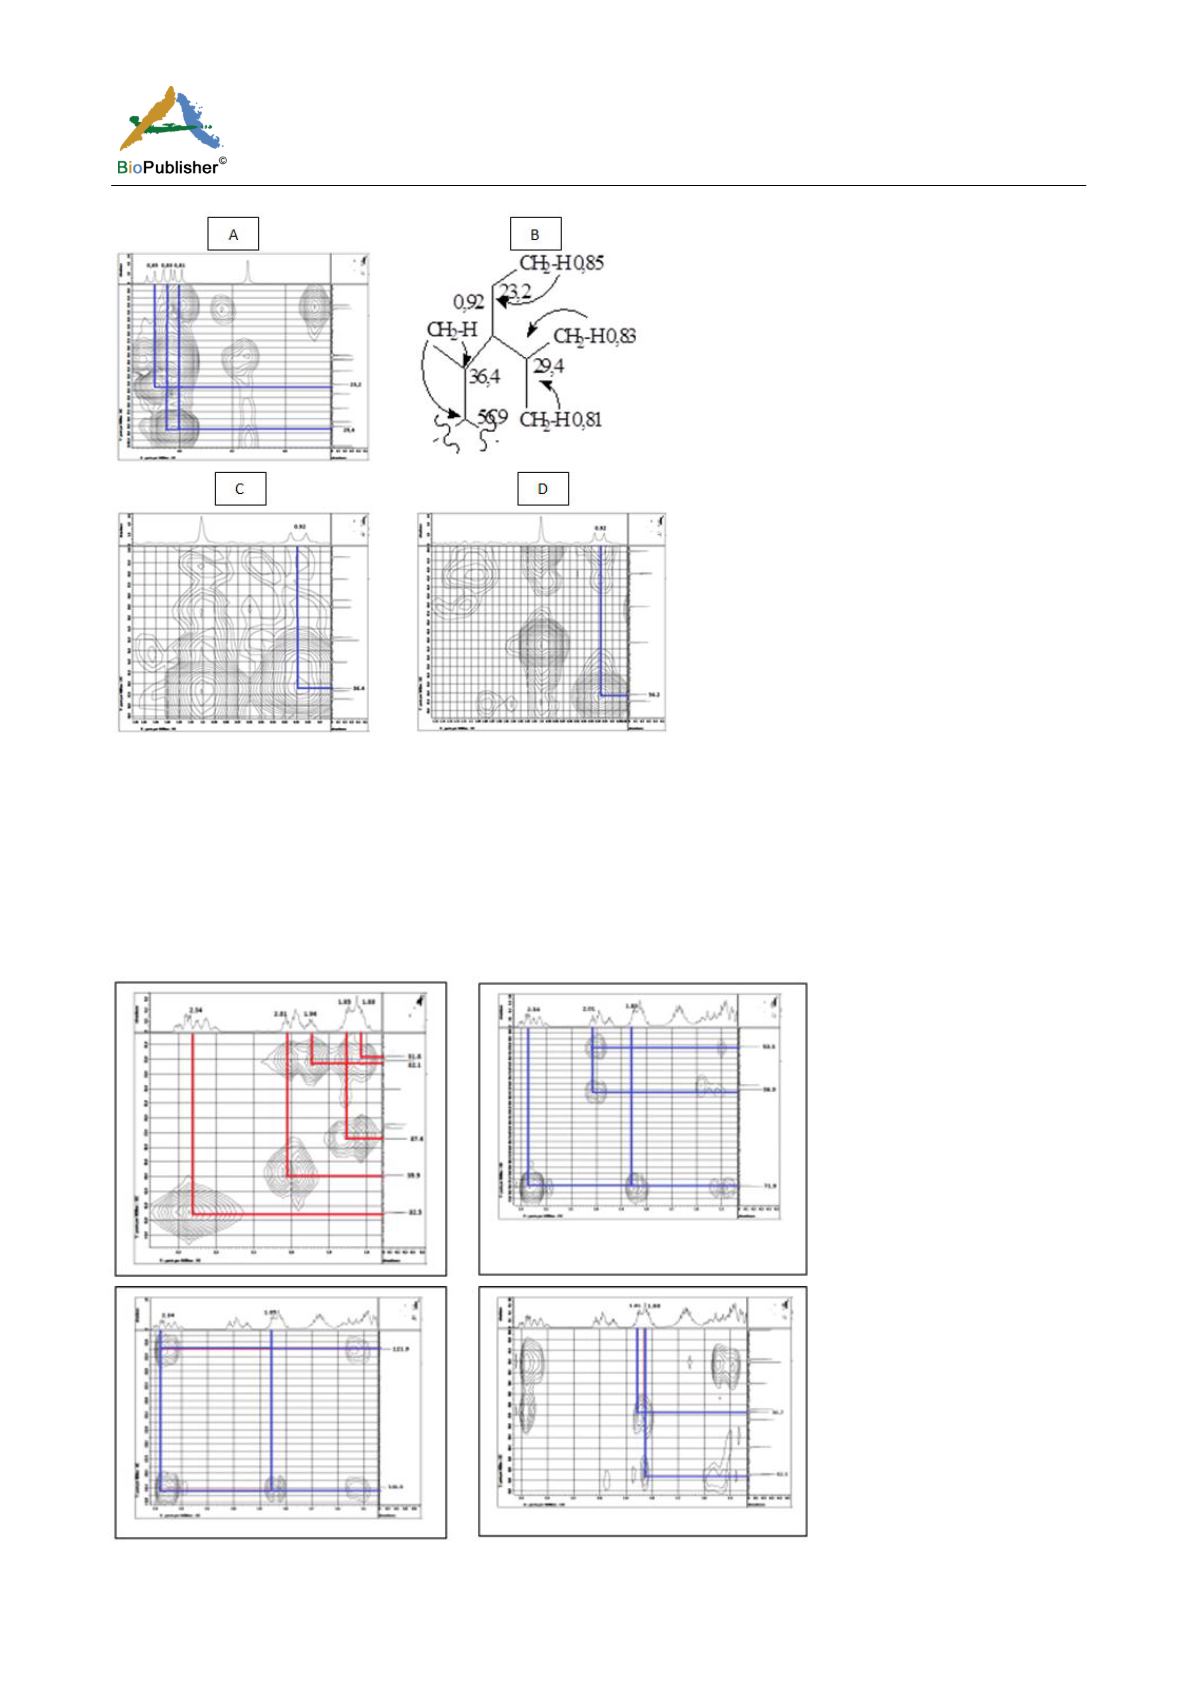
Figure 6 HMBC spectrum fragment area δH 0.6 ppm - 0.8 ppm carbon δH in the area δc 1.0 ppm - 32.0 ppm δc (A)
Note: Piece structure with HMBC correlation. Fragment HMBC spectrum in the area δH 0.92 with carbon in the area δc 36.4 and
56.2 ppm (6C and 6D)
Fragment HMQC spectrum (Figure 7) shows that the proton that appears in the δH 2.01 ppm and δH 1.94 ppm
(2H, m) in the HMQC spectrum seen attached to a carbon at 39.9 ppm δc area and 32.1 ppm. Proton in the ppm
and 1.85 ppm δH 1.83 seen attached to a carbon in the carbon δc 31.8 ppm and 37.4 ppm in the area. Proton in the
area δH 1.51 ppm carbon bonded to the area δc 21.3 ppm and the proton HMBC spectrum is seen to correlate with
the carbon in the area δH 50.3 ppm (Figure 8; Figure 9).
Figure 7 HMBC and HMBC correlation of isolated compounds on the area δH 1.94 – 2.34 ppm


