International Journal of Marine Science, 2017, Vol.7, No.31, 297-307
301
DEPT spectrum showed 29 signals that appear in the 13C-NMR spectrum only looks 25 DEPT spectrum signal at
135. This indicates the presence of 3 pieces of carbon in the form of C kwartener. DEPT 135 spectrum widening
seemingly metin 9 carbon atoms, 11 carbon atoms of methylene and methyl 6 carbon atoms. Methyl carbon signal
for each - each appear δc 121.9; 71.9; 56.9; 56.2; 50.3; 46.2; 36.4; 32.1; and 29.1 ppm. While the methylene
carbon signals for each - each appearing on δc area 42.3; 39.9; 37.4; 34.1; 31.8; 28.4; 26.5; 24.5; 23.2 and 21.3
ppm. Methyl carbon signals each - each appearing on δc 19.8; 19.6; 19.2; 19.0; 12.5 and 12.0 ppm.
2.4.3 Identification with NMR 2D spectrum
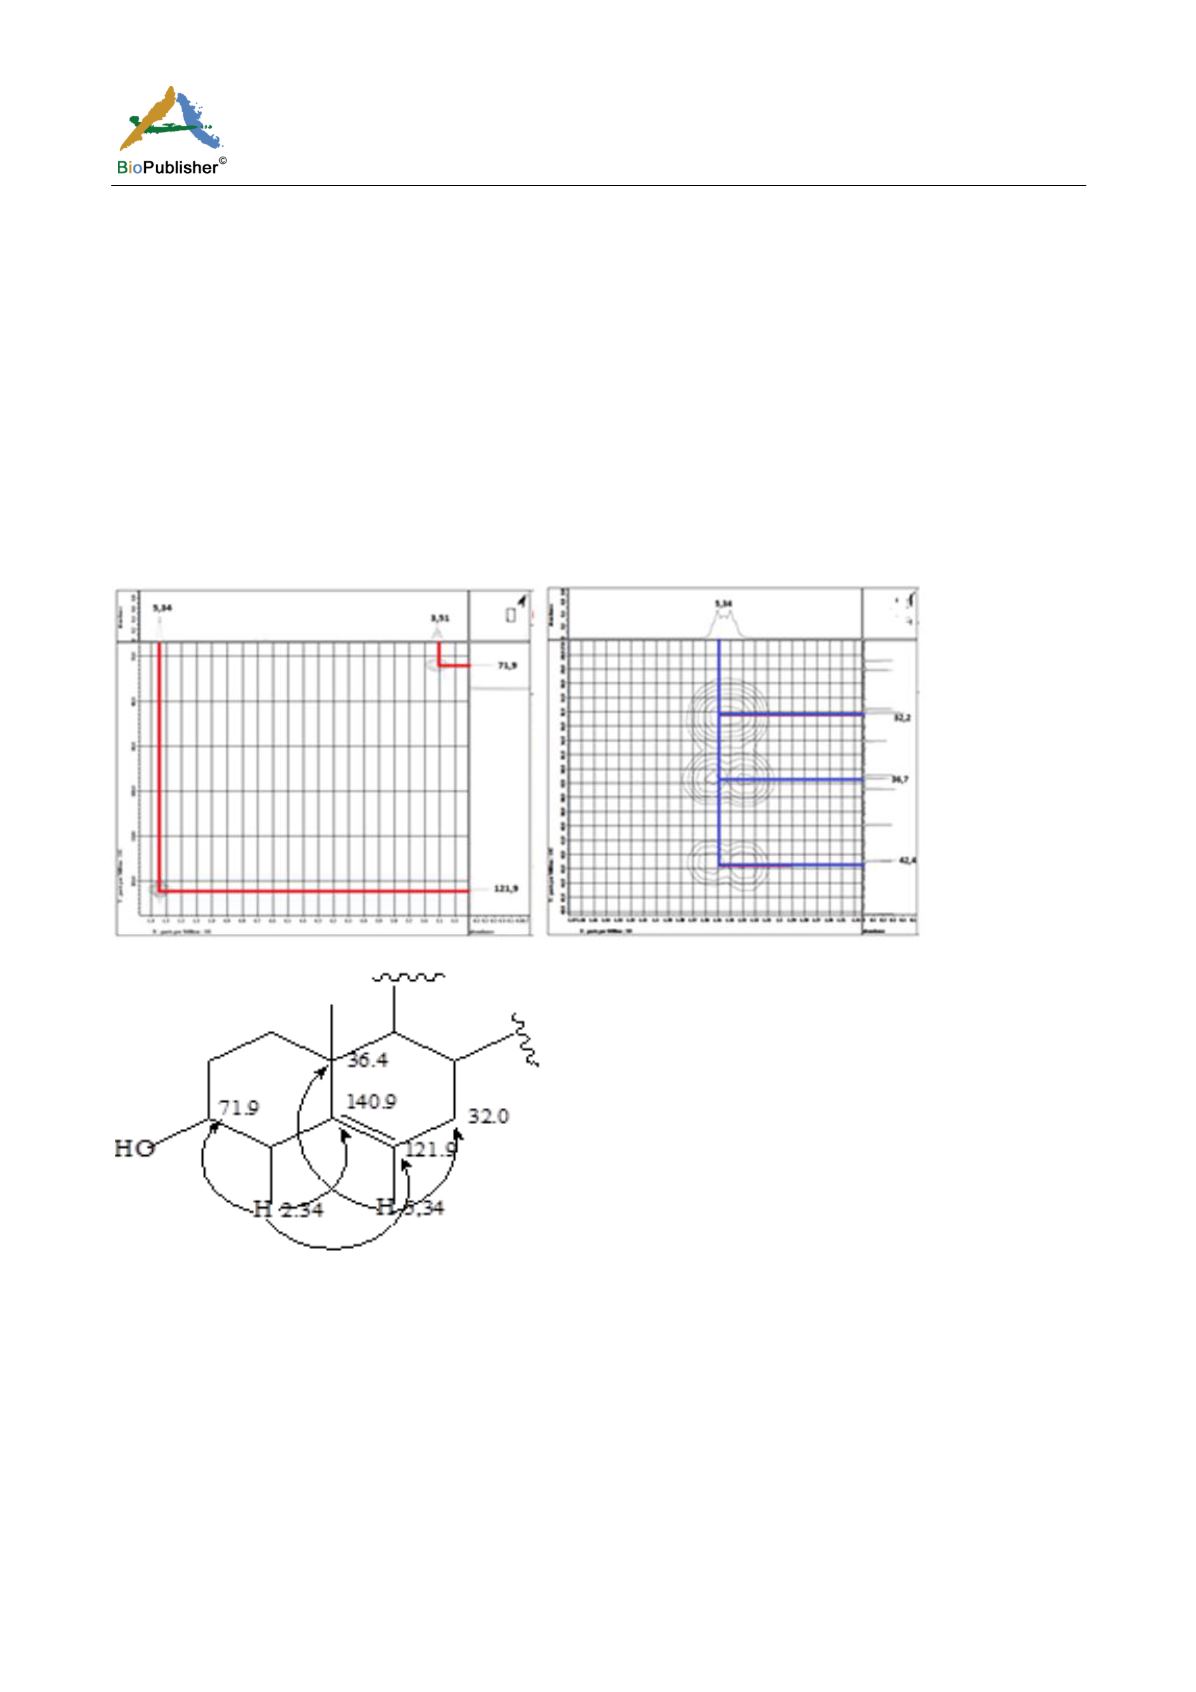
In the HMQC spectrum it seen that the proton at area δH 5.34 ppm bound to the carbon in the area δc 121.9 ppm,
then the proton at area δH 3.51 ppm is directly bonded to the carbon at 71.9 ppm δc area. HMBC spectrum
(Figure 4) shows that the proton at δH 5.30 ppm region correlated with the carbon in the area δc 32.2; 36.7; 42.4
ppm. Fragment HMQC spectrum also showed that the proton at δH 2.34 area is attached directly to the carbon at
42.5 ppm δc area. HMBC spectrum of this proton showed a correlation with the carbon in the area δc 71.9; 121.9
and 140.9 ppm (Figure 5).
Figure 4 Fragment HMBC spectrum of protons in the area δH 3.51 to 5.34 with the carbon in the δc 71.9 to 121.9 ppm
Figure 5 Fragment HMQC spectrum of protons in the area δH 0.60 - δH 1.10 ppm carbon in the area δc 8.0 - 2.70 ppm δc
Spektrum HMBC proton in the area δH 5.34 ppm with carbon δc 27,0 – 46,0 ppm. Protons at δH 0.81 area; 0.83;
0.84; 0.92 ppm respectively - each bonded to carbon in the area δc 19.6; 19.8; 12.0; 19.0. Two other methyl
protons appear in the δH 0.67 ppm and 1.01 ppm, respectively - each attached to a carbon at 12.0 ppm and δc in
the area δc 19.2 ppm.
Fragment of HMBC spectrum (Figure 6) shows that the proton at δH 0.81 area; 0.83 and 0.85 ppm correlated with
carbon at 46.2 ppm δc area. Proton δH 0.67 ppm in the area visible in the area correlated dengankarbon δc 39.9;
42.4; 56.2 and 56.9 ppm. Proton δH 0.81 ppm area and protons in the area δH 0.83 ppm correlated with the carbon
in the area δc 29.1 ppm. Pieces of the structure in the HMBC correlations presented in Figure 7. Fragment in the
HMBC spectrum 8C and 8D δH 0.92 ppm image.


