International Journal of Marine Science, 2017, Vol.7, No.31, 297-307
303
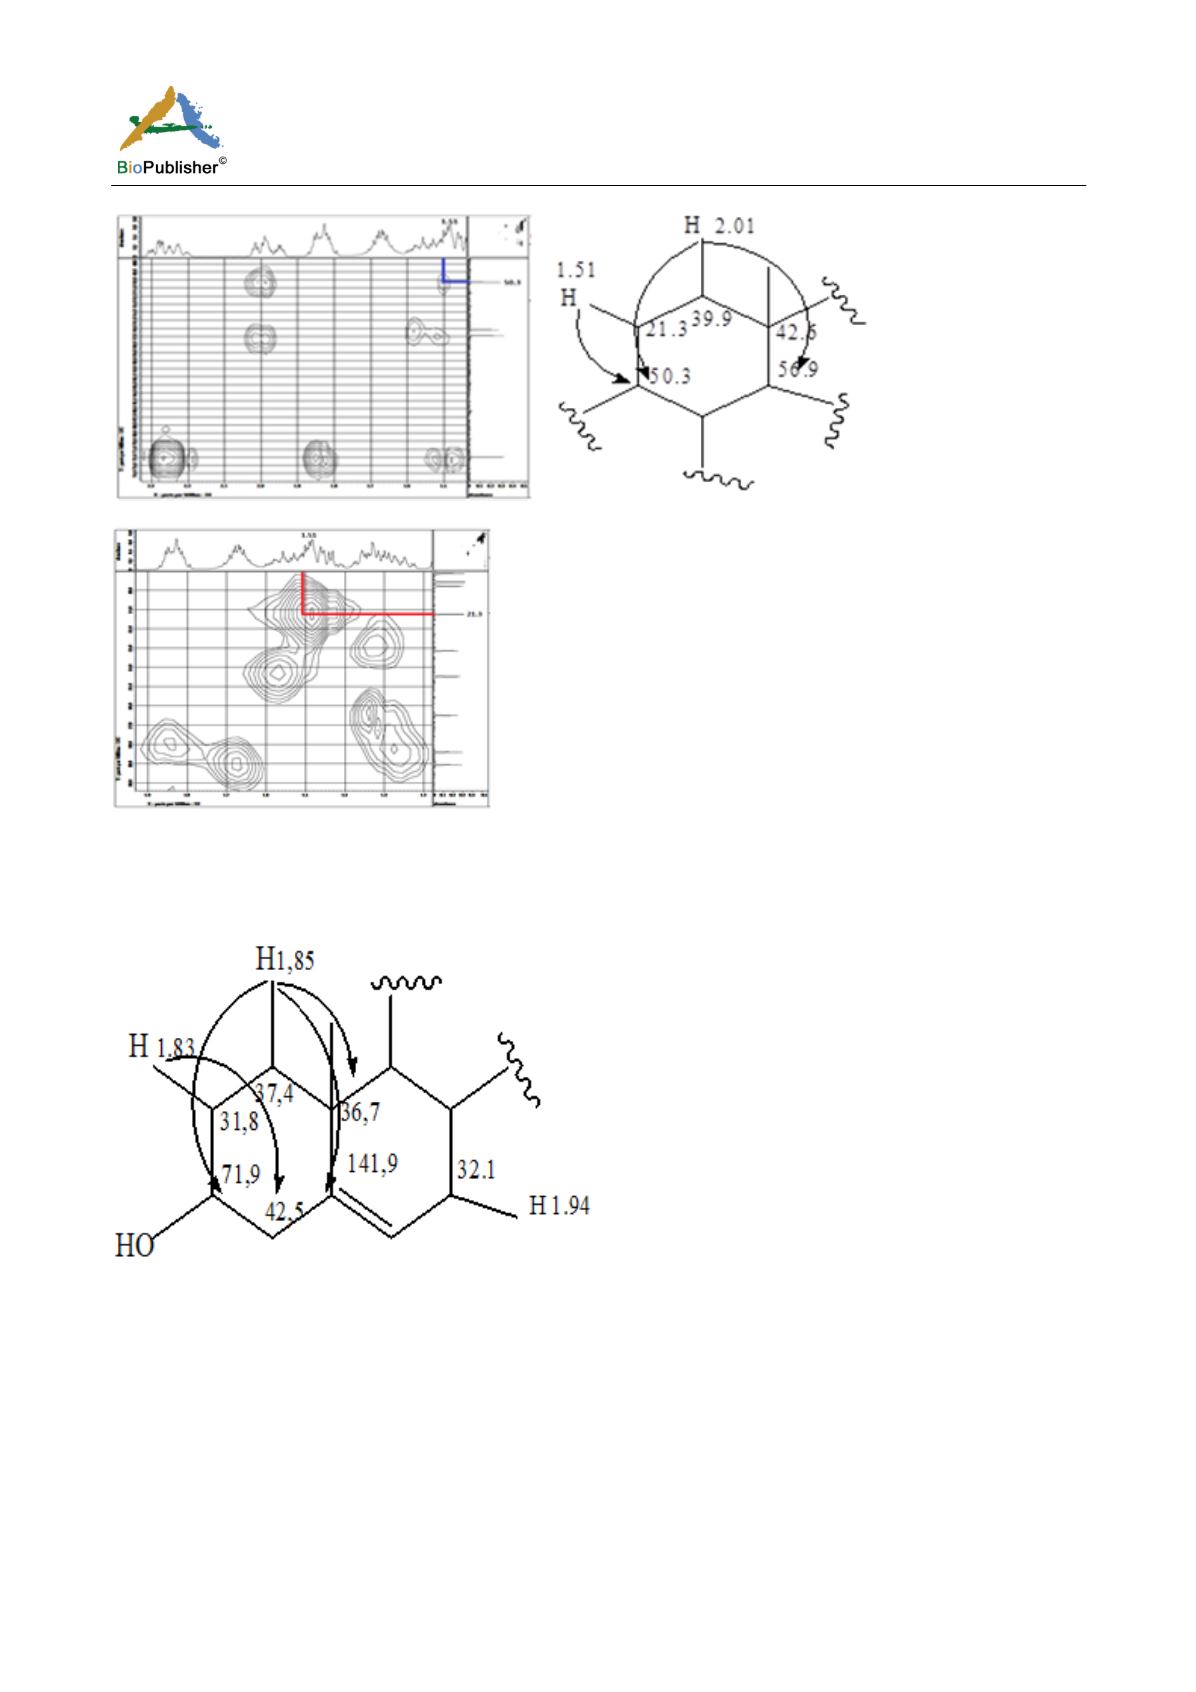
Figure 8 Fragment structures in areas isolated compounds 1.51 and 2.01 ppm in correlation HMBC
Figure 9 Fragment HMQC spectrum of protons in the region in the area of carbon δH dengan δc 21.3 ppm
Analysis HMBC spectrum (Figure 7) shows that the proton in the area δH 1.85 correlated with the carbon in the
area δC 141.9 ppm, δH 71.9 ppm and δH 36.7 ppm, while the protons at 1.83 ppm area correlated with carbon in
the area δc 42.5. Fragment isolated structure with HMBC correlation given in Figure 10.
Figure 10 A fragment structure of isolated compounds with correlation HMBC
COSY spectrum analysis of isolated compounds, showing a correlation between the protons in the area δH 3.54
with protons in the area δH 2.24 ppm. Proton in the area δH 3.54 also shows a correlation with the proton in the
area δH 1.83 ppm. Proton signals in the area δH 5.34 ppm correlated with protons in the area δH 1.94 ppm.
Fragment of proton COSY spectrum - these protons are presented in Figure 11. This portion of the structure with
COSY correlations are presented in Figure 12.
Based on the analysis of 1H-NMR spectrum, 13C-NMR and DEPT 135 then identified isolated compounds are a
group of steroid compounds, namely β- sitosterol (Figure 13) with the molecular formula C29H50O BM 414
g/mol and DEPT of 5 pieces.


