International Journal of Aquaculture, 2015, Vol.5, No.23 1
-
12
4
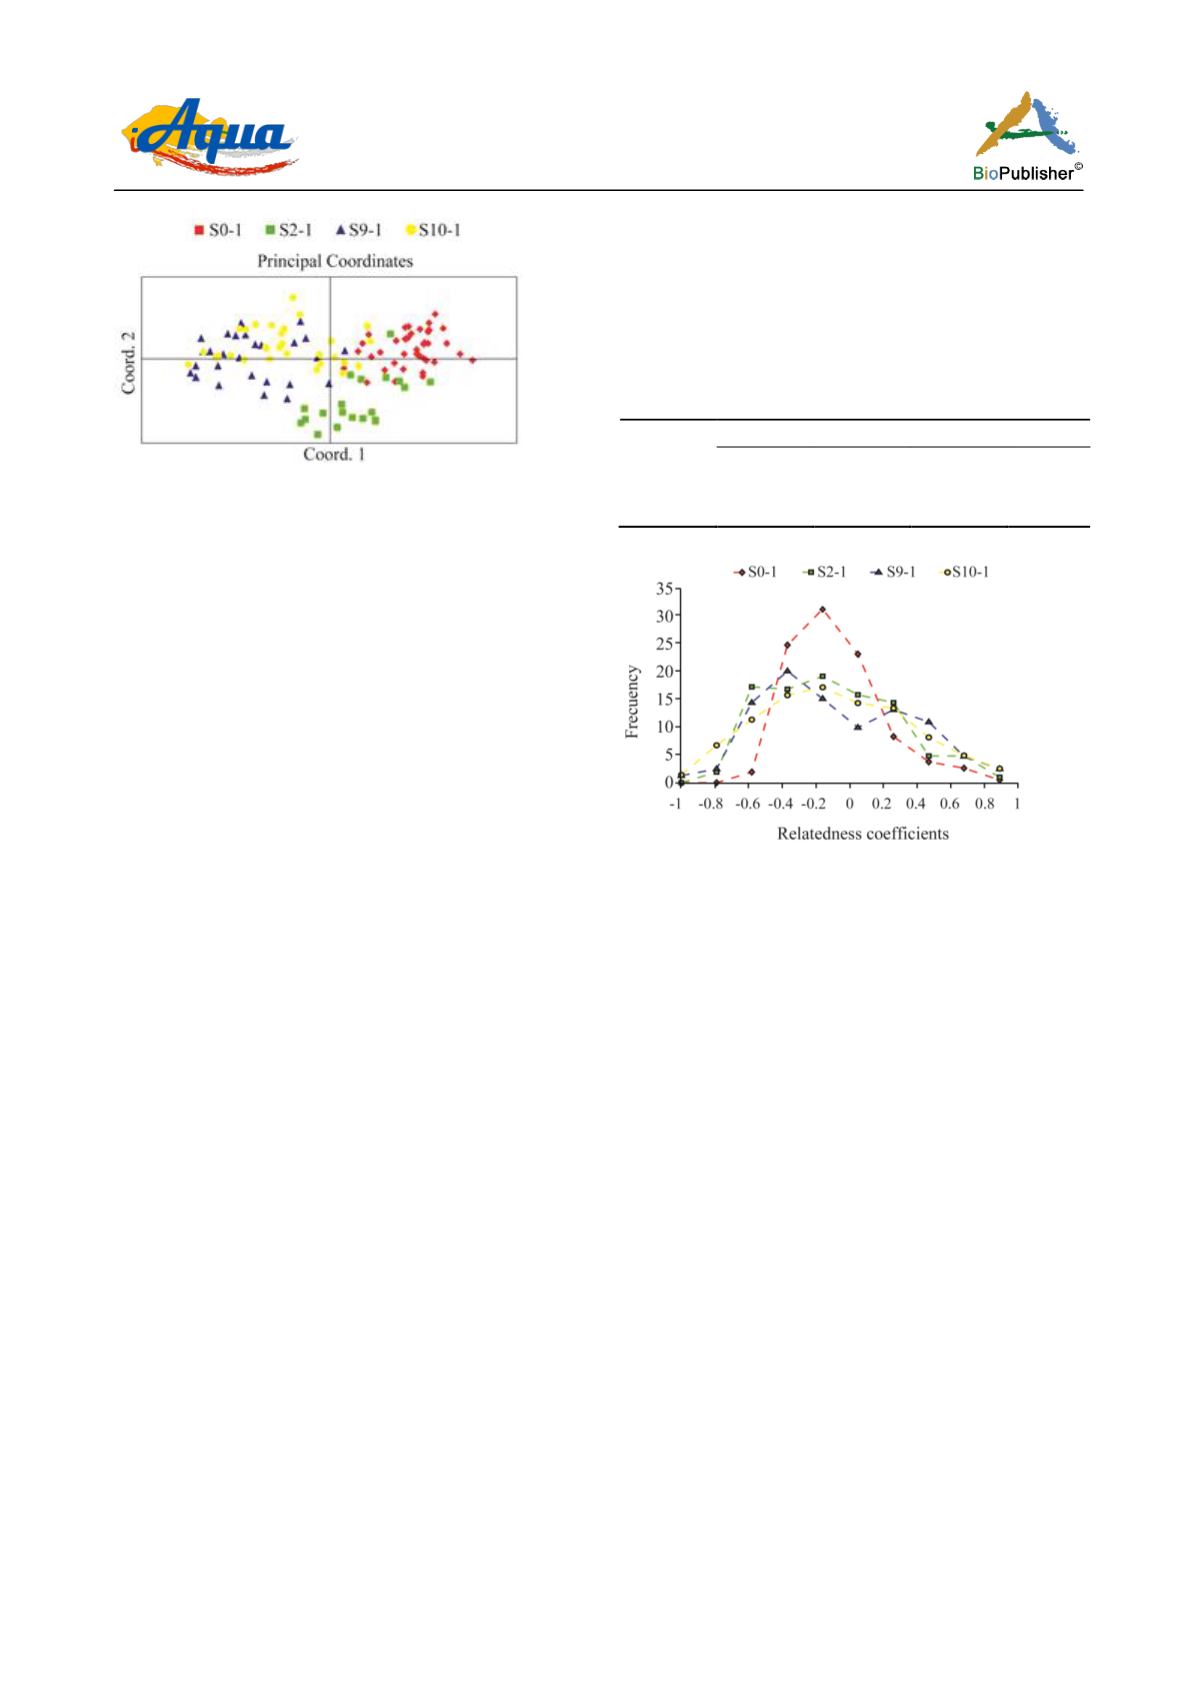
Figure 3 Principal coordinates (PCoA) of genetic distances
among the first founder stock (S0-1) of
P. vannamei
introduced
in Cuba for the culture and three descendant stocks: second
(S2-1), ninth (S9-1) and tenth (S10-1) generations
positive values in all cases and either none of the
populations is in Hardy-Weinberg equilibrium (Table 2).
The distributions of relatedness coefficients calculated
by Queller and Goodnight, 1989 estimator between
individual pairs of the four stocks showed highest
frequencies in negative values. Only S9-1 showed a
bimodal distribution with high frequency in negative
values about -0.2 and other smaller peak in positive
values around of 0.5. (Figure. 4)
The program COANCESTRY (Wang, 2011) lets to
compare by a bootstrap method, the generated r
coefficients distributions for pairs of individuals,
resulting in statistical differences among all the
analyzed stocks, except for S2-1 and S10-1, but the
observed values are very near of the 95 percentile
values of the confidence interval. Two examples of the
output data after bootstrap comparisons are shown in
Figure 5.
All Bottleneck program output tests (Sign test,
Standardized difference test and Wilcoxon test) under
the three models: Infinite Allele Model, IAM; Step
Mutation Model, SMM and Two Phase Model, TPM
had significance (p≥0.05) for the assumption of a
heterozygosis excess. A typical L-shape graphic is
obtained for every tested stock (Figure 6) but, however
slight variations from the L-shape for S9-1 and S10-1
are observed.
2 Discussion
The sustainability of shrimp aquaculture industry is
accomplished taking into a consideration of many
facts, including handling, health and nutrition of captive
Table 2 Deviation from the equilibrium (Fis values) and its
associate probability (pFis) for the first founder stock of
P.
vannamei
(S0-1) and its descendants: the second (S2-1), nine
(S9-1) and ten (S10-1) generation stocks calculated for the four
loci
: M1, Pvan 1758, Pvan 1815 and Pvan 0040. Calculations
were made using the FSTAT program (version 2.9.3) software
application. Bonferroni correction was used with α=0.00313
and 320 randomizations
Parameter
Stocks
S0-1
S2-1
S9-1
S10-1
Fis
0.179
0.176
0.214
0.182
PFis
0.0031
0.0063
0.0031
0.0031
Figure 4 Distributions of relatedness coefficients between
individual pairs (calculated by Queller and Goodnight estimator)
of the first stock of
P. vannamei
introduced in Cuba (S0-1) for
the culture and its three descendant stocks: second (S2-1), ninth
(S9-1) and tenth (S10-1) generations
species, and of course, the market price. Besides,
aquaculture offers the opportunity to improve our
basic knowledge about different species. In that way,
genetics and molecular biology became in important
tools not only to characterize natural and captive
populations, but also to develop new treatments,
improving diets and leading to basic and specific
knowledge of molecular immunology, gene expression
and genomics of different organisms with economic
importance (Liu and Cordes, 2004). Several commercial
domesticated strains of shrimps, particularly of penaeid
have been developed in the world, for example in
Hawaii, Venezuela, Colombia, Tahiti, México, Brazil
and USA. These strains are currently available to
producers who want to take advantage of selective
breeding programs developed elsewhere in the world
(Cuzon et al., 2004).
Although domestication and maintenance in captivity
is an advantage for biomass production and market


