International Journal of Aquaculture, 2015, Vol.5, No.23 1
-
12
10
3.3 Microsatellite genotyping.
DNA was extracted with 5% or 10% Chelex – 100
resin (Walsh et al., 1991). Polymerase Chain Reaction
(PCR) were carried out in Eppendorf thermo cycler
for loci M1 (Wolfus et al., 1997) and Pvan 1758, Pvan
1815 and Pvan 0040 (Cruz et al., 2002) and were
checked in 2 % agarose gel electrophoresis stained
with ethidium bromide. The program was as follows:
94ºC during 5 minutes, 35 cycles at 94ºC for one
minute, hybridization temperature variable depending
of each loci during 30 seconds, 72 ºC 45 seconds (end
of the cycle) and a final elongation at 72 ºC during 10
minutes. Hybridization temperatures by
loci
were: 50
ºC in Pvan 1815, 52-54 ºC in M1 and 45-48 ºC in Pvan
0040. A commercial mix of formamide/bromophenol
blue was added to each vial with amplified products in
1:1 proportion. After that, denaturation of amplified
products with colorant was carried out in the same
Eppendorff thermo cycler and then was applied in 6%
and urea 7 mol/L acrylamide – bis acrylamide vertical
gels. The applied voltage was among 2500-3000 V and
potency of about 80 W. After the electrophoretic run off,
the gels were fixed with 10 % Acetic Acid solution,
stained with 0.1 % silver nitrate- 0.05%
formaldehyde and developed with 3 % sodium
carbonate0.05% formaldehyde and 20 µg/mL sodium
thiosulfate. Samples previously genotyped by Artiles
et al., 2011a were used as controls for each microsatellite
locus, with sizes ranging from 194 to 240 for M1, 140
to 146 for Pvan0040, 110 to 136 for Pvan 1815 and
174 to 188 for Pvan 1758. PGEM®, STR III, FFV and
CTT were also included as conventional markers.
3.4 Statistics and calculations.
The analysis and interpretation of productive data was
carried out using Statgraphics statistical package,
version 3.5.2 (StatPoint Technologies, 2010) The
normality was previously checked for a 0.05
significance level and when accomplished a simple
ANOVA was used and the Multiple Range Test was
applied if significant differences among means were
found. Otherwise a non-parametric test (Kruskal-Wallis)
was applied with the same significance level.
The number of alleles per locus, the frequency of each
allele and the values for observed (Ho) and expected
(He, according to Nei, 1978) heterozygosity for each
locus, as well as whether the populations were in
Hardy-Weinberg equilibrium, was calculated with the
GeneAlEx (version 6.1) software application (Peakall
and Smouse, 2006). Any locus with at least two alleles
where the frequency of the most common allele did
not exceed 95% was considered polymorphic (Graur,
2000).
Deviations from equilibrium were corroborated by
calculating Fis (Wright, 1965), following the formula
Fis = 1 - (Ho/He), with the FSTAT software application
(version 2.9.3;Goudet, 2002). Although it depends on
population size, it is unaffected by the presence of
multiple alleles per locus, the number of individuals
per population or the number of populations.
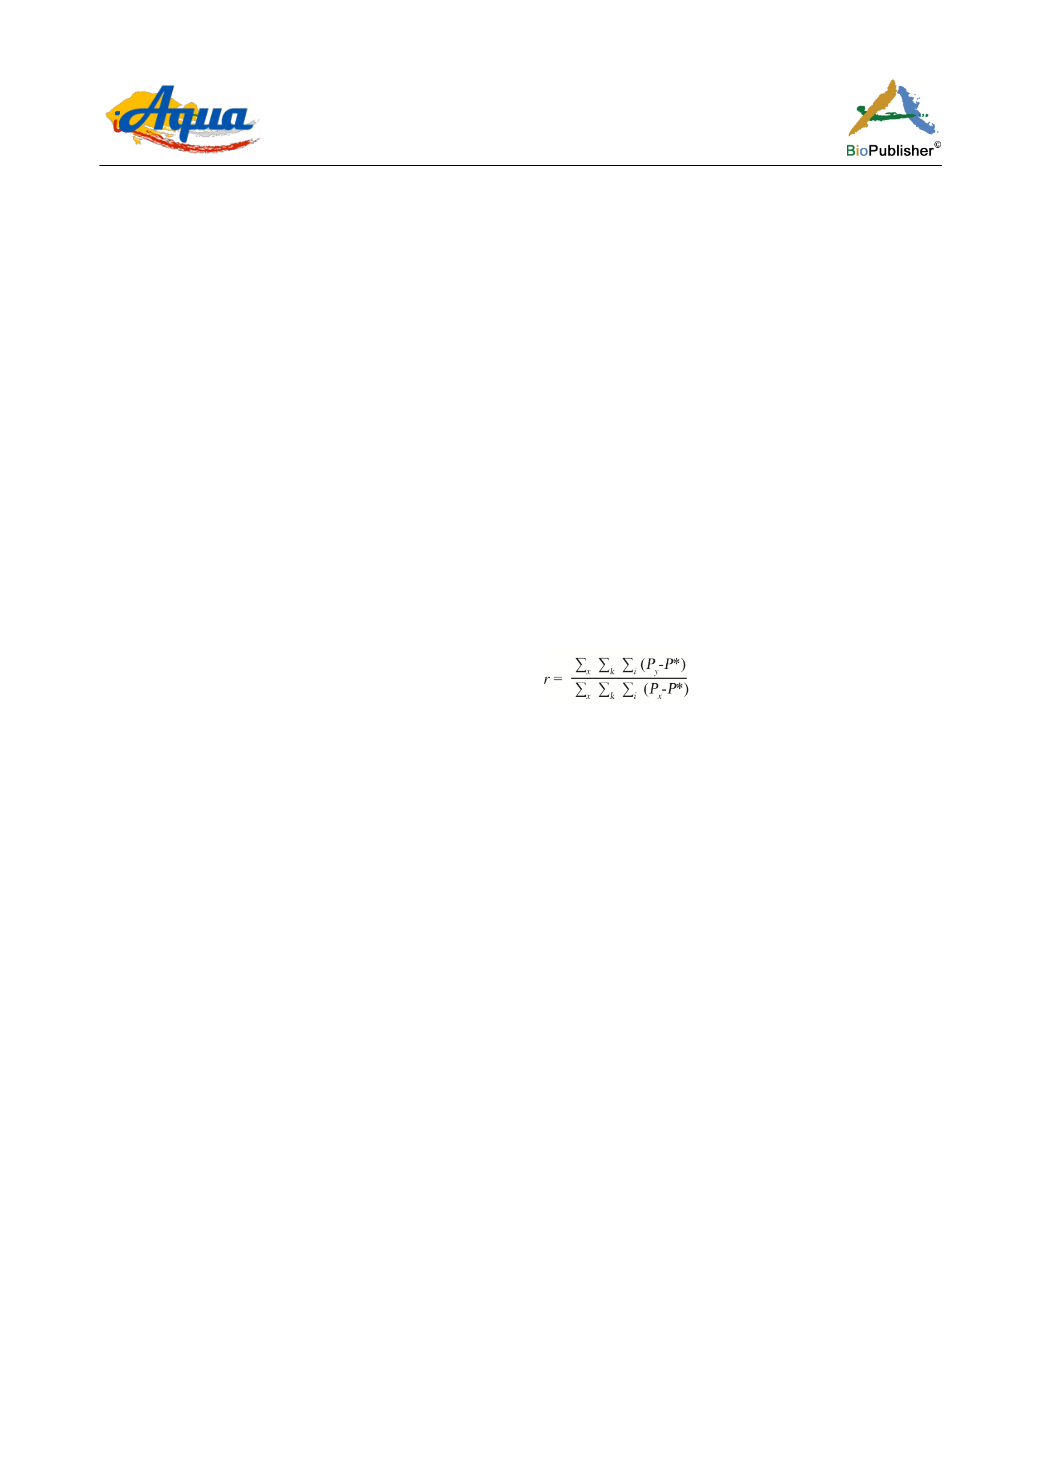
The genetic relatedness coefficient (r;Queller and
Goodnight, 1989) for a single pair of individuals and
the test of difference between groups was also
calculated with COANCESTRY v1.0 (Wang, 2011).
This coefficient is calculated for codominant markers,
using the following formula:
where: x stands for the individuals; k for the loci; l for
allelic positions (two for diploids and one for
haploids), Px is the frequency of individual “x” for
locus k and allelic position l, Py is the frequency of
the allele “y” in the group or individual compared to x;
and P* is the total frequency of the allele in the
population. The genetic relatedness coefficient must
be r ≤ 0 for non-related individuals; r = 0.25 for half
siblings and r ≥ 0.5 for full siblings.
The graphic of the distribution of relatedness
coefficients was made in MatLab R2013a (8.1.0.604)
program.
To check if there were variations in genetic diversity
parameters, a 10000 iterations Monte Carlo analysis
was performed using the Pop Tools v3.15 (add-insdel
MS Excel) program.
To seek if a recent bottleneck effect would be
produced, the Bottleneck program was run (Piry et al.,
1998). All different test proposed by the authors were
accomplished (Sign test, Standardized difference test
and Wilcoxon test) under the three models: Infinite
Allele Model, IAM (Maruyama and Fuerst, 1985);
Step Mutation Model, SMM (Cornuet and Luikart,
1997) and Two Phase Model, TPM.


