International Journal of Aquaculture, 2015, Vol.5, No.23 1
-
12
2
possible the stability of the shrimp industry (Tizol et
al., 2004), replacing the main cultivated native species
in the country
Litopenaeus schmitti
, that did not
contribute to the projected productive yields. Since the
very beginning of the
P. vannamei
culture, higher
productions in the five shrimp culture Enterprise Base
Units (EBUs) have been obtained. In that way,
handling techniques, nutrition, health management
and genetic breeding programs were altogether
re-established for a suitable yield of this resource for
the mentioned species,
P. vannamei
.
Many authors have reported a decline in genetic
diversity when comparing natural populations with
captive ones for different shrimp species such as in
Litopenaeus stylirostris
(Bierne et al., 2000a);
P.
monodon
(Xu et al., 2001) and
P. vannamei
(Garcia et
al., 1994; Wolfus et al., 1997). Nevertheless comparing
several generations of cultured
P. vannamei
,
non-significant fluctuations in genetic variability has
been obtained (Cruz et al., 2004; Luvesuto et al., 2007;
Perez-Enriquez et al., 2009; Souza De Lima et al.,
2010; Vela-Avitúa et al., 2013). However, this last
mentioned Mexican group (Vela-Avitúa et al., 2013)
using more microsatellite
loci
as genetic markers and
pedigree information found a non-significant decline
in genetic diversity for two nonconsecutive generations of
cultured
P. vannamei
. In neither of those studies,
production markers have been shown and so, the
possible effect of this genetic variation could not be
evaluated. Besides, inbreeding has been indirectly
determined by Fis (measure of departure from
Hardy-Weinberg disequilibrium within a subpopulation)
calculation and not by relatedness coefficients.
In total, five stocks of Specific Pathogen Free (SPF)
animals of
P. vannamei
from Shrimp Improvement
System in USA (SIS) have been introduced into Cuba
from 2003 to 2008. All five stock as well as crossing
combinations and some descendants have been genetically
characterized (Borrell et al., 2006; Machado-Tamayo,
2006; Artiles et al., 2011a; Pérez-Beloborodova et al.,
2012). In fact, neither in those cases productive
markers have been shown nor so the decrease or
maintenance of genetic parameters through different
generations of the same line has not been proved. In
order to use genetic management as a tool for farm
producers the aim of this work is to seek both
productive and genetic tendencies in four progeny
stocks of the first introduction of
P. vannamei
used in
Cuba for aquaculture.
1 Results
1.1 Productive marker of four descendant of the first
founder stock of
P. vannamei
in Cuba for culture.
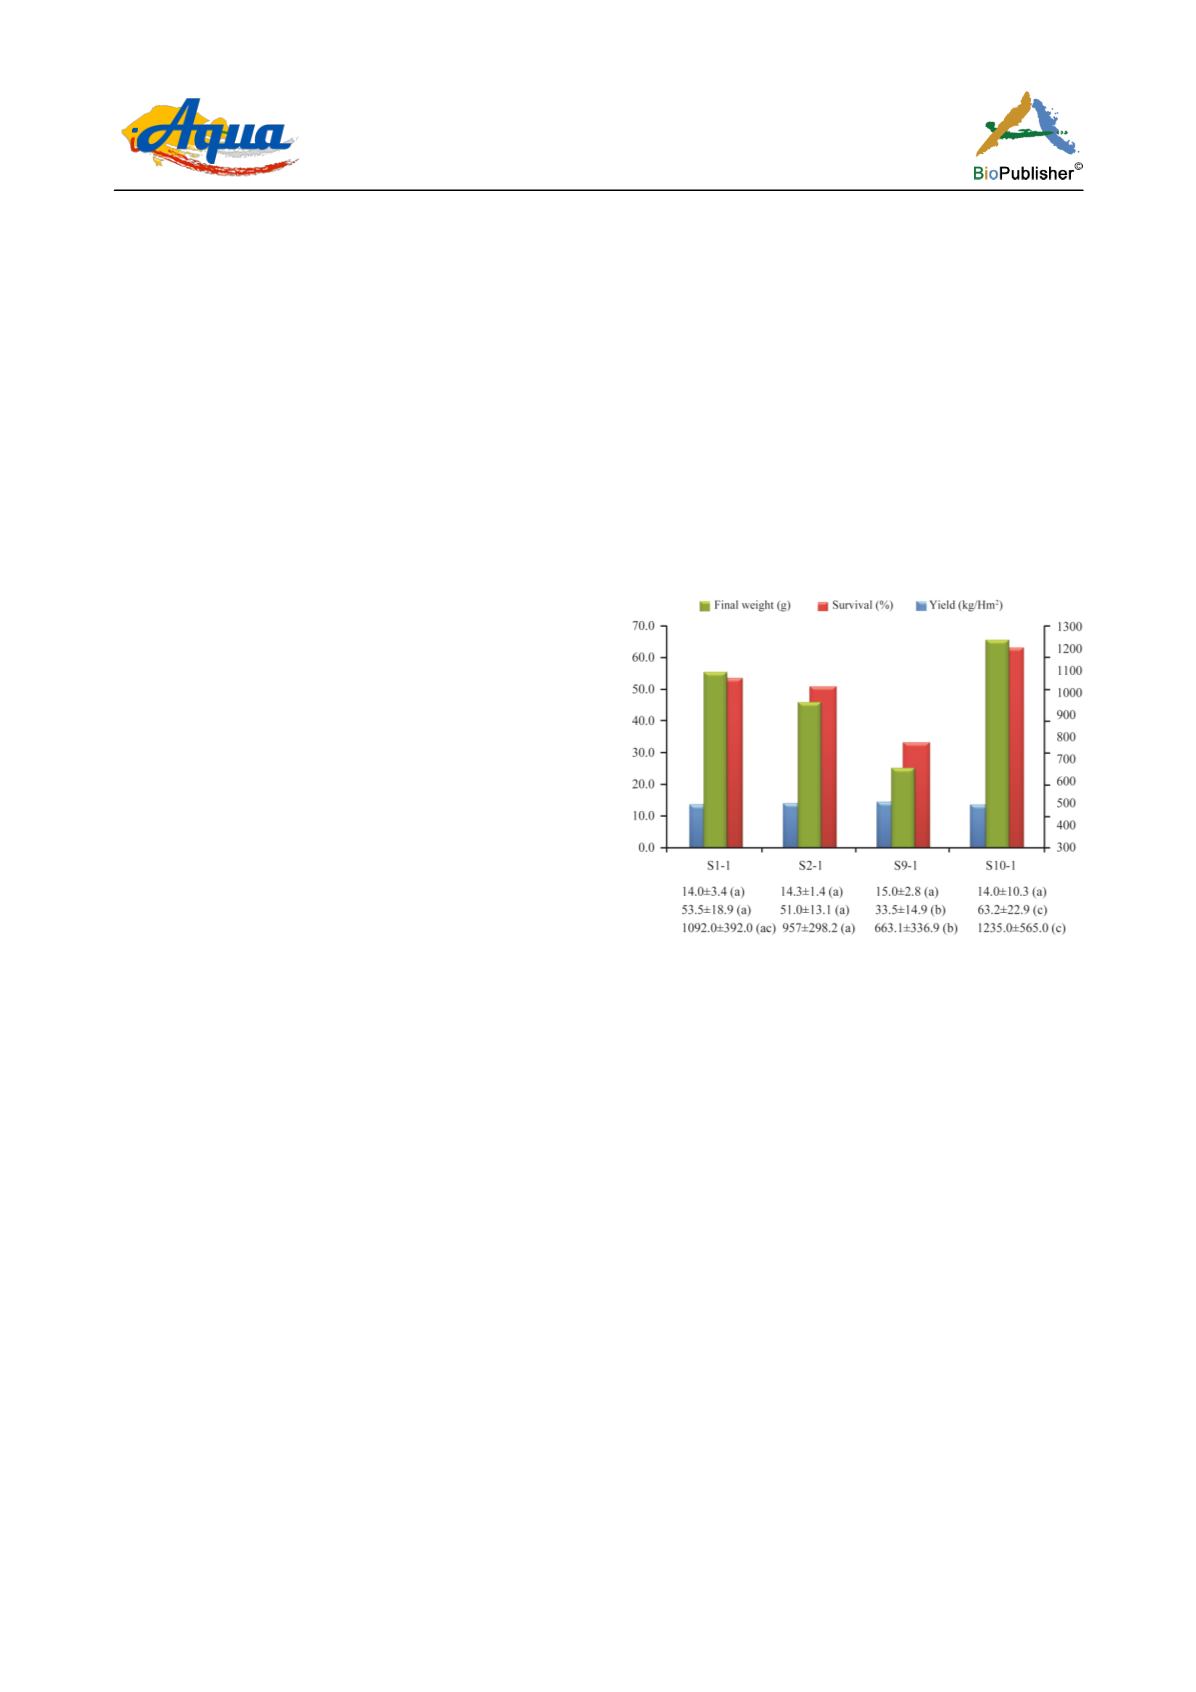
Two of the three productive indicators were variable
among generations (Figure 1). Both survival (%) and
yield (Kg/Hm
2
/cycle) of the first, second and tenth
offspring generations (S1-1, S2-1 and S10-1), were
significantly different (p ≤ 0.05) from the ninth one
(S9-1). This last stock offered the lowest values of the
whole analyzed productive process. On the other hand,
the final weight (g) did not show significant differences
(p ≥ 0.05) among the four studied progenies.
Figure 1 Average productive markers: survival (%), yield
(Kg/Hm
2
/cycle) and final weight (g) of four progenies of the
first founder stock of
Penaeus vannamei
introduced and cultivated
in Cuba. Dissimilar letters indicate significant differences in
Kruskall-Wallis test (α=0.05)
1.2 Genetic parameters
of the first introduced
stock of
P. vannamei
in Cuba for culture and three
of its descendant
All averages of genetic parameters values: Allele
number (Na), Allelic Richness (AR), Effective allele
number (Ne), Private allele number (Np) as well as
observed and expected heterozygosities (Ho and He
respectively) are highest in the first introduced brood
stock and remain similar from the second, ninth and
tenth generations as it is shown in Figure 2.
This variation of the first introduced brood stock
comparing to the rest of the descendant, is significant
(p≤0.05) for those parameters that involve quality of
the alleles, but not for heterozygosities (Table 1). For


