International Journal of Aquaculture, 2015, Vol.5, No.23 1
-
12
3
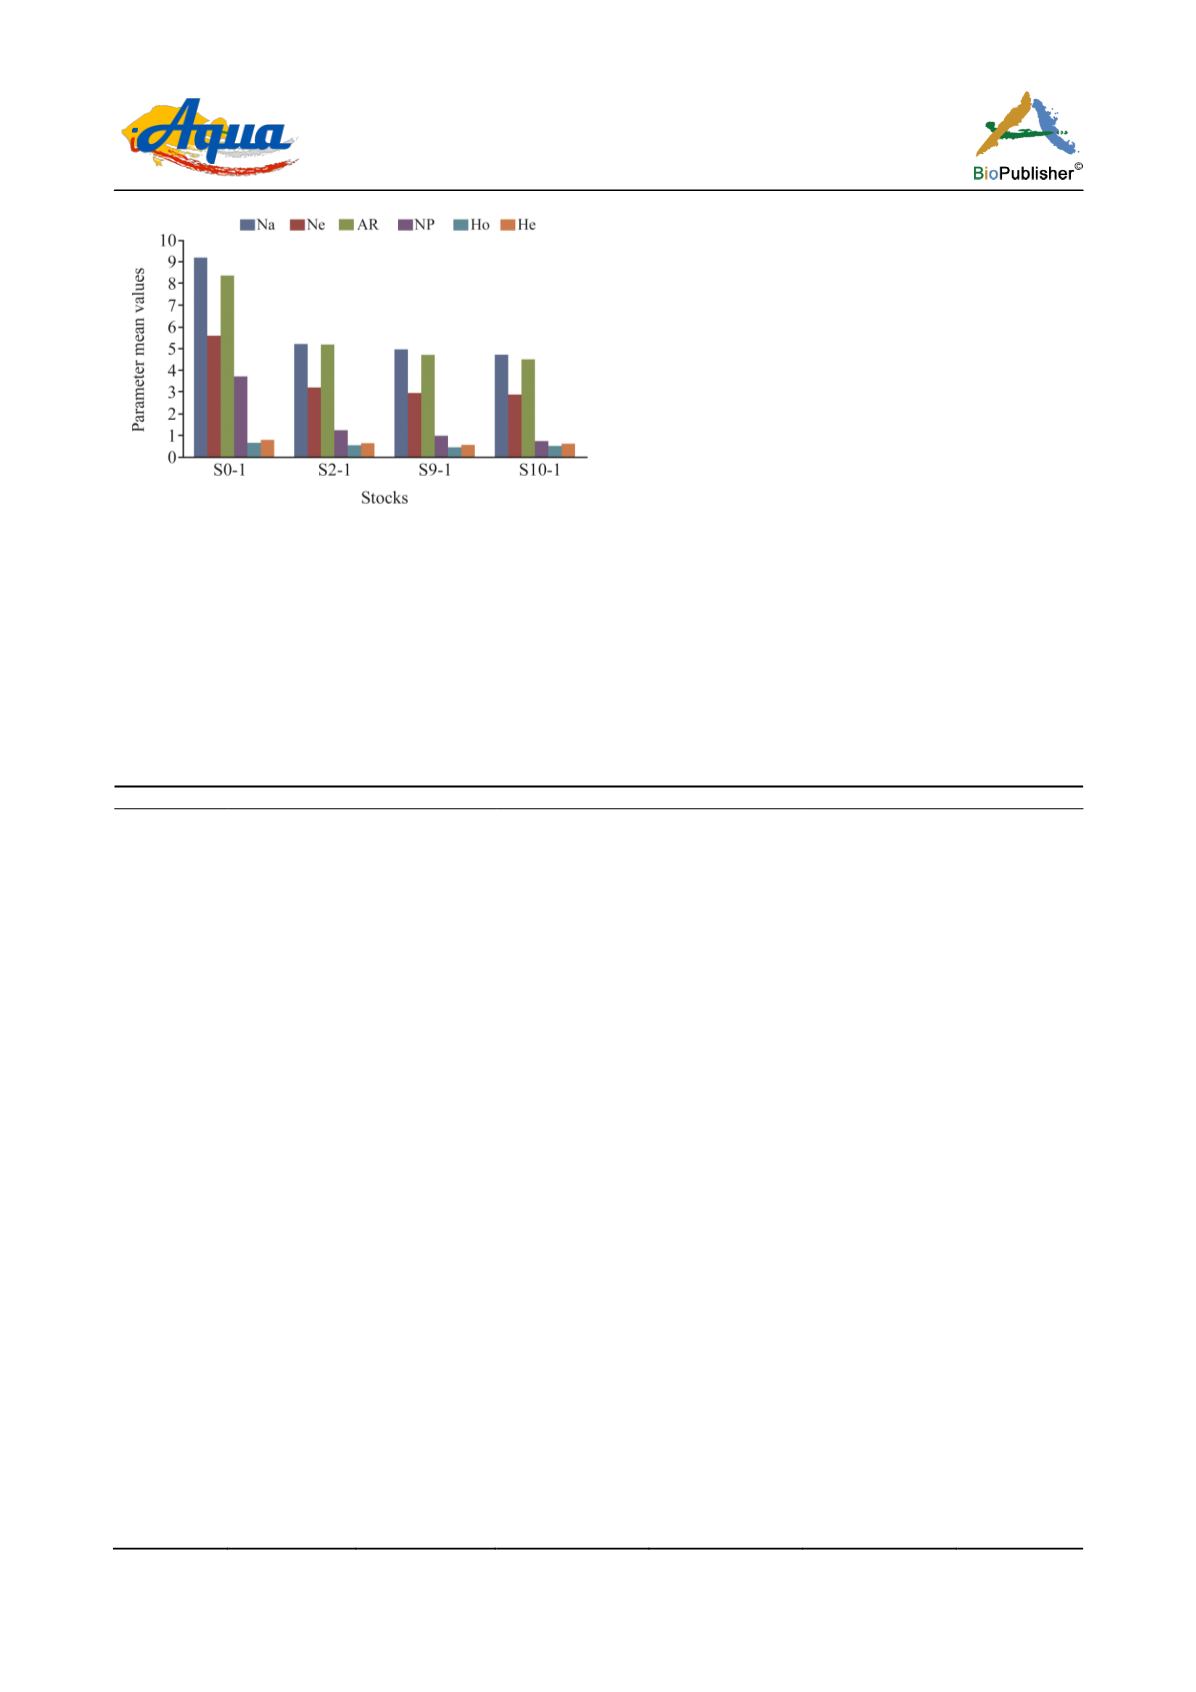
Figure 2 Averages genetic diversity values: Allele number (Na),
Effective allele number (Ne), Allelic richness (AR), Private allele
number (Np), Observed heterozygosity (Ho) and Expected
heterozygosity (He) for the first stock (S0-1) of
P. vannamei
introduced in Cuba for the culture and its three descendant stocks:
second (S2-1), ninth (S9-1) and tenth (S10-1) generations
expected heterozygosity, there is only significance
between S0-1 and S9-1, but the difference (0.227) is
very close to the upper confidence limit, CL (0.229).
A similar whole picture is found when a principal
coordinates analyses (PCoA) is accomplished. Figure
3 shows a clear founder group (S0-1, in red) that
shares information with the other three clusters, but
it’s closer to the second generation (S2-1). The latest
generations (S9-1, in blue; and S10-1 in yellow) are
mixed together and slightly far from the other two stocks.
1.3 Inbreeding, Bottleneck effect and Relatedness
coefficient
of the first introduced stock of
P.
vannamei
in Cuba for culture and three descendants.
The calculation by FSTAT program of the deviations
from the equilibrium (Fis values) and its associate
probability for the four mentioned stocks showed
Table 1 Difference values and confidence limit (CL) in the null model of Monte Carlo analysis (10 000 permutations) of genetic
parameters among the first stock (S0-1) of
P. vannamei
introduced in Cuba for the culture and its three descendant stocks: second
(S2-1), ninth (S9-1) and tenth (S10-1) generations
Allele Number Lower CL-3.5 Upper CL 3.5
S0-1
S2-1
S9-1
Difference
Probability
Difference
Probability
Difference
Probability
S2-1
4.000
0.012
S9-1
4.250
<0,01
0.250
0.465
S10-1
4.500
<0,01
0.500
0.413
0.250
0.465
Allele Number Effective Lower CL-2.516 Upper CL 2, 448
S0-1
S2-1
S9-1
Difference
Probability
Difference
Probability
Difference
Probability
S2-1
2.395
0.028
S9-1
2.651
0.018
0.255
0.412
S10-1
2.725
0.016
0.330
0.386
0.075
0.475
Allelic Richeness Lower CL-3,0205 Upper CL 2, 9875
S0-1
S2-1
S9-1
Difference
Probability
Difference
Probability
Difference
Probability
S2-1
3.708
<0,01
S9-1
4.716
<0,01
1.008
0.456
S10-1
5.966
<0,01
2.258
0.070
1.250
0.206
Private Allele Lower CL-2,5 Upper CL 2, 25
S0-1
S2-1
S9-1
Difference
Probability
Difference
Probability
Difference
Probability
S2-1
2.500
0.024
S9-1
2.750
0.013
0.250
0.456
S10-1
3.000
<1,01
0.5
0.378
0.25
0.456
Observed Heterozygosity Lower CL-0.311 Upper CL 0.309
S0-1
S2-1
S9-1
Difference
Probability
Difference
Probability
Difference
Probability
S2-1
0.110
0.249
S9-1
0.205
0.102
0.095
0.277
S10-1
0.143
0.190
0.033
0.418
-0.062
0.353
Expected Heterozygosity Lower CL-0.241 Upper CL 0.229
S0-1
S2-1
S9-1
Difference
Probability
Difference
Probability
Difference
Probability
S2-1
0.145
0.106
S9-1
0.227
0.026
0.082
0.229
S10-1
0.175
0.064
0.030
0.390
-0.052
0.325


