International Journal of Marine Science 2015, Vol.5, No.55: 1-9
3
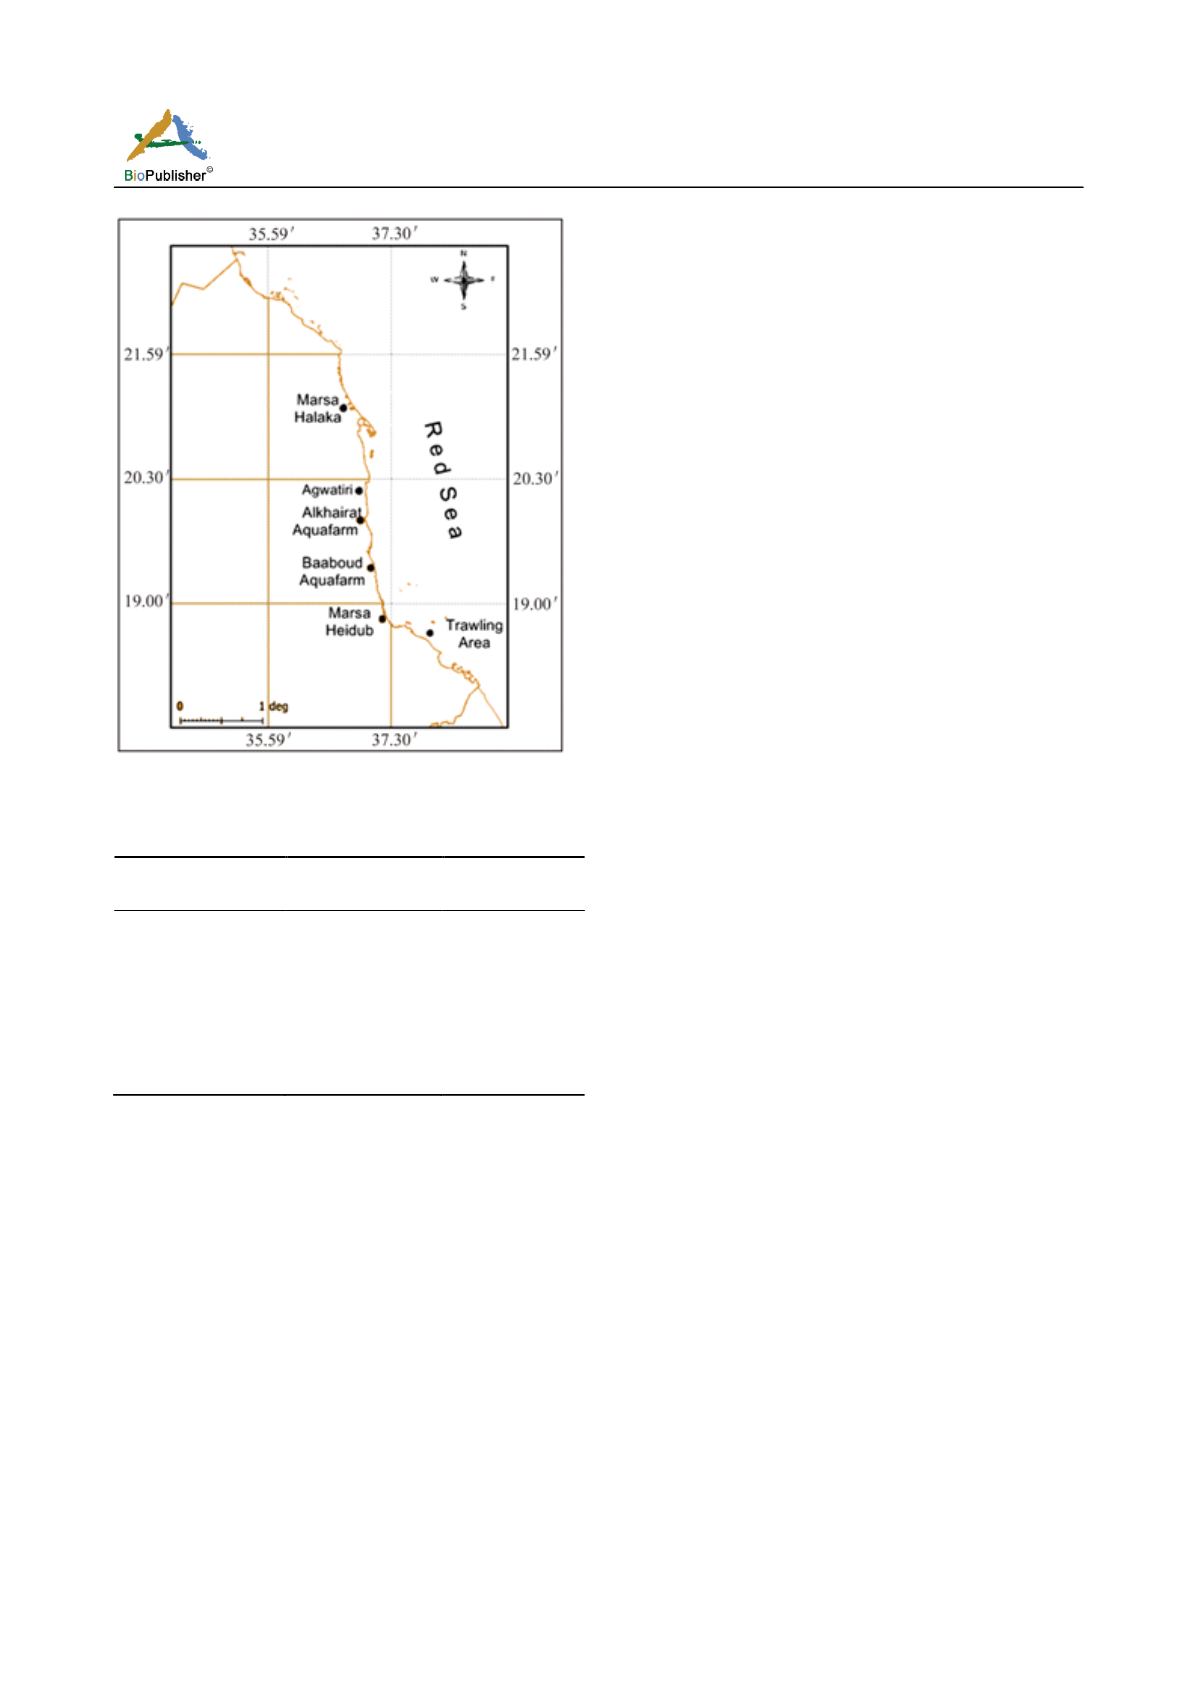
Figure 1 Map of the Sudanese Red Sea showing the collection sites
Table 1 Collection area, the species and number used in the study
Collection area
Species
No. of samples
analysed
Alkhairat aquafarm
F. indicus
15
Baaboud aquafarm
F. indicus
15
Wild(fish market)
F. indicus
12
Marsa (Halaka)
P. monodon
9
Marsa (Heidub)
P. monodon
9
Trawling area
P. semisulcatus
7
Trawling area
M. monceros
5
water and stored in -20ºC. The partial 16S ribosomal
rRNA mtDNA gene (16S rRNA gene) was amplified
using universal primers 16SarF (5’-GCCTGT
TTAACAAA AACAT-3’) and16SbrR (5’-CCGGTCT
GAACTCAGATCATGT-3’) following (Simon et al.,
1991). The PCR reagents were obtained from
Vivantitis. Amplification was carried out in a total
volume of 50 µL PCR mixture containing 50-100 ng
of template DNA, 2.5 µL of 10x PCR buffer, 1.6 µL
MgCl
2
, 1 µL dNTP, 2 µL of each primer, 0.2 µL of
Taq
DNA polymerase. Amplification was performed
in a G-Storm Thermal Cycler (Gene Technologies Ltd,
Braintree, Esses, CM77 6tz, UK). with a profile of
pre-cycle denaturation at 94ºC for 4.30 min, followed
by 30 cycles of 1.30 min at 94°C, 1min at 51-56°C
(optimizing annealing temperature), 1 min at 72°C
(extension temperature), and a final extension of 5
min at 72°C. 5 µL of the PCR products were
electrophoresed through a 2.5% agarose gel and
stained with GelRedTM Nucleic Acid Gel Stain
(10,000X in water, 0.5ml) which is proved to be more
sensitive than the ethidium bromide. The amplified
fragments were visualized by illumination with short
wave ultraviolet light and photo documented.
Amplified DNA from individual shrimp specimens
was purified by using QIAquick PCR purification kits
(Qiagen, Valencia, CA) following the protocol
recommended by the manufacturer. Samples of
purified products were sent to Centre of Chemical
Biology (CCB), USM, Malaysia for sequencing.
2.3 Sequence analysis
Mismatching alignments were checked by eye for
sequence reading errors. Sequences were edited and
aligned using Clustal W, Bio-Edit software (version)
and CLC main workbench version 6.5 (Devereux et
al., 1984).
Species identifications were confirmed
through Blast analysis with Genbank sequences
(NCBI). And the sequence with accession number
DQ149968 (Shekhar et al, 2005) was chosen as a
reference because it was 100% aligned with most of
the study sequences. DNA sequences of other
Penaeus
species were obtained from Genbank [(FJ002573
(Shekhar et al., 2008); AY751800 (Zhou and Jiang,
2004) and GU573957 (Rahnema et al., 2010)] for
phylogenetic comparison. Sequence variation, and
SNP events of the gene were analyzed and/or exported
using Mega5.05 (Tamura et al., 2011). A neighbor-joining
(NJ) tree using Kimura’s 2-parameter model (Saitou and
Nei, 1987; Tamura et al., 2004) with 1000 bootstrap
replicates, based on pairwise genetic distance was
constructed in Mega 5.05. Dna SP version 5.10.1
(Hudson et al., 1992) was used to calculate the gene
flow (Nm) and genetic differentiation (Fst).
3 Results
3.1 Amplification of 16S rRNA gene
The PCR product of approximately 480 bp from 16S
rRNA gene were obtained from most of the samples,
Figure 2 shows examples of amplified products of
F.
indicus
,
P. monodon, P. semisulcatus
and
M. monoceros
.


