Molecular Plant Breeding 2016, Vol.7, No.11, 1
-
16
5
and 3 from Akurdat. All the individuals belonging to
samples collected from institutions in Eritrea (HAC
and NARI) and abroad (AVRDC and KALRO) and
more than 50% from Afabet clustered together in
Cluster 3. However, five of the eight genotypes of the
outgroup (Tomato) and few genotypes each from
AVRDC, Gindae, Mendefera, Elabered and Akurdat
separated into a small cluster (Cluster 4) located
between clusters 2 and 3. This clustering pattern was
confirmed by neighbour joining method (Figure 2).
Overall, the local Eritrean peppers showed the same
clustering pattern like the factor analysis method
except that 2 individuals from NARI and 6 from HAC
moved from cluster 3 to clusters 1 and 2 (Figure 2).
However, the major difference between the two
methods was that genotypes from AVRDC and
KALRO populations joined clusters 1 and 2
respectively. KALRO2 (the outgroup) joined cluster 2
and formed a distinct group in sub-cluster IV that
included four improved AVRDC varieties and one
from each Mexico and Ethiopia in addition to one
genotype from KALRO1 and a few local genotypes.
Similarly, 12 individuals from AVRDC moved from
cluster 3 to cluster 1 forming with some Eritrean
germplasm sub-cluster II. AVRDC materials in this
sub-cluster included 5 Ethiopian, 3 Italian, 2 Mexican
and 2 improved varieties (Figure 2).Cluster 3
comprised four sub-clusters. The first sub-cluster
(sub-cluster V) was the major sub-cluster composed of
individuals from HAC, NARI and Afabet, in addition
to few individuals from AVRDC, KALRO1 and
Dekemhare. The second sub-cluster (sub-cluster VI)
comprised 11 individuals from Afabet,two from NARI
and one from each Gindae and Elabered. The third
sub-cluster (sub-cluster VII) was composed of 23
individuals from AVRDC and only two local
genotypes from Dubarwa and Dekenhare. The
AVRDC germplasm in this sub-cluster included all the
Indian and the majority of the Italian accessions. HAC
also formed a small sub-cluster (Sub-cluster VIII)
composed of five individuals (Figure 2).
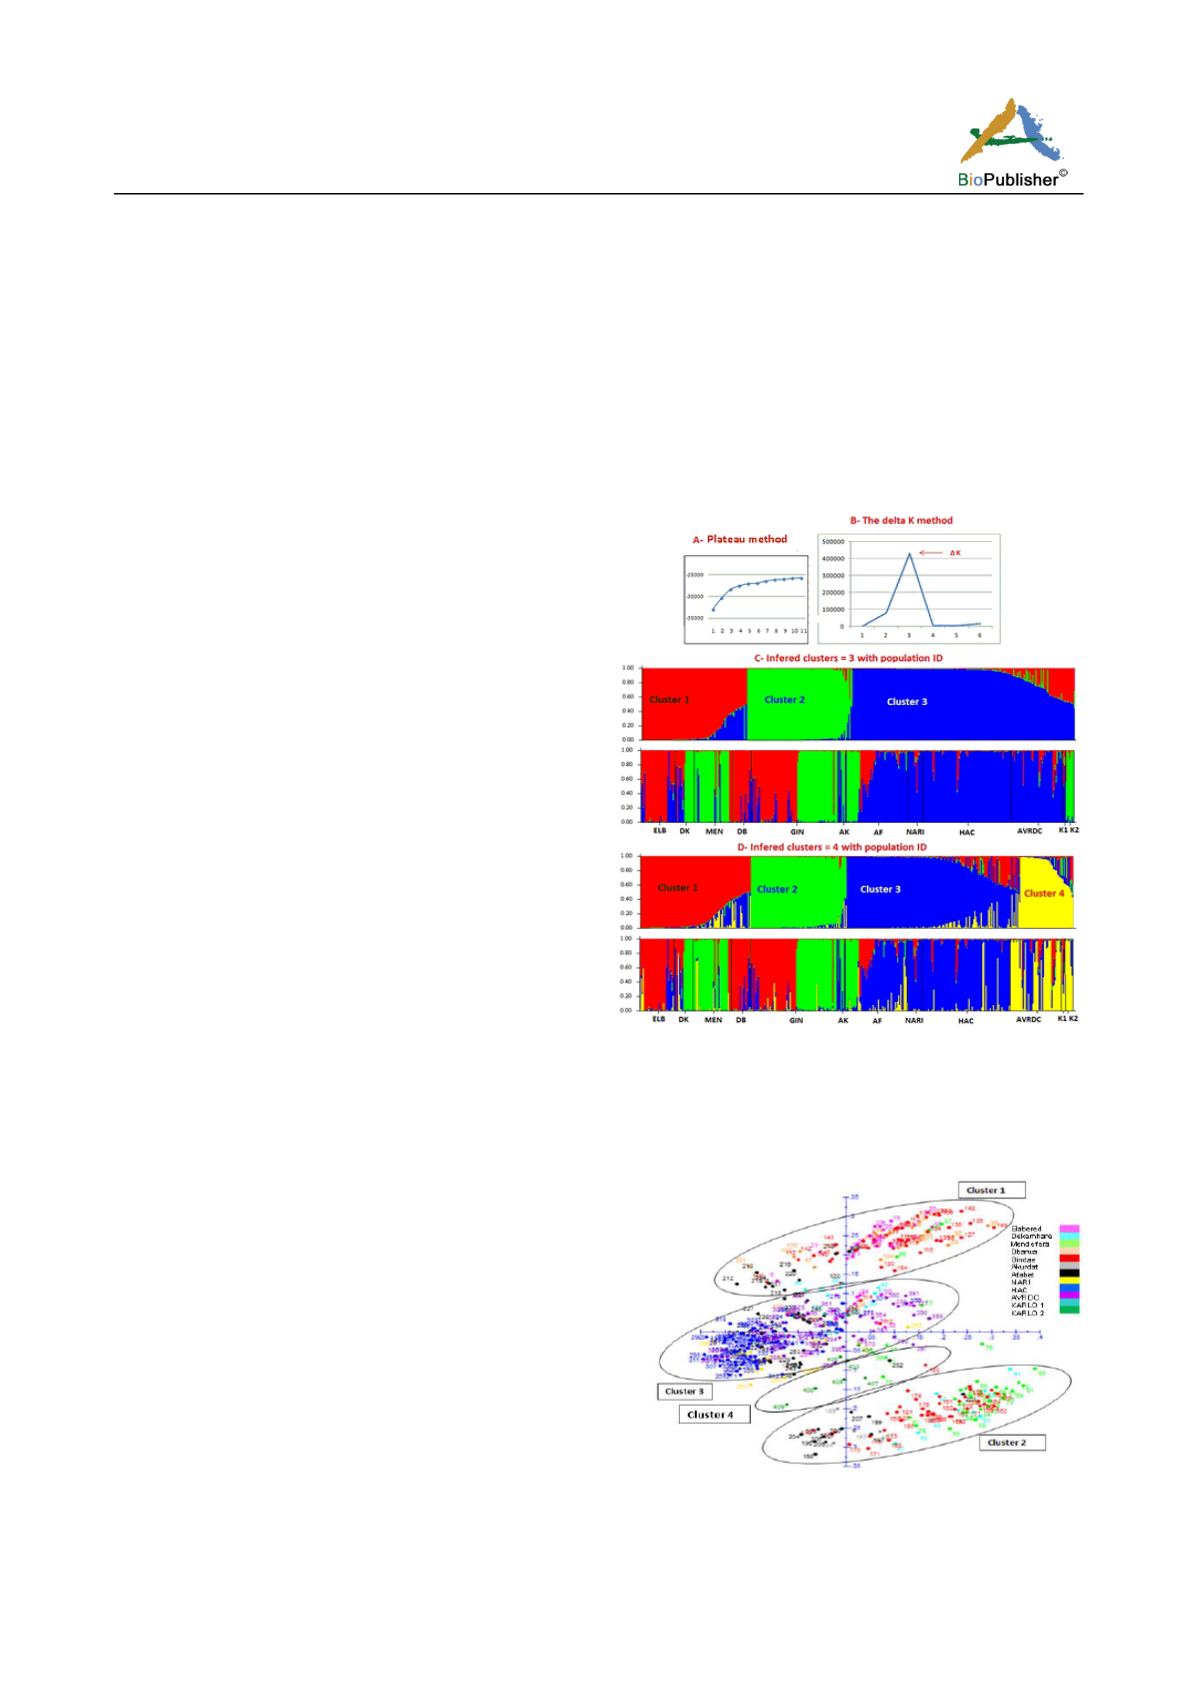
The ad hoc value ∆K ran from Structure showed high
likelihood value that confirmed the existence of three
clusters (Figure 3) as previously inferred by the factor
analysis (Figure 1) and the neighbour joining tree
(Figure 2). The assignment of individuals into the
three clusters was in agreement with factor analysis.
This was slightly different in the tree constructed from
dissimilarity matrix using Dar Win in which only
62.5% of AVRDC individuals inferred into cluster 3
compared to 90% according to the model based
method (Figure 3) and 100% with factor analysis
(Figure 1). Figure 3 shows that at least 90% of the
genotypes from the three institutions viz HAC (97%),
NARI (91%) and AVRDC (90%) inferred together in
cluster 3. Only 3% from HAC and 8% each from
NARI and AVRDC inferred in cluster 1.
Figure 3 Model-based clustering of the 407 genotypes using 28
SSR markers showing determining the number of clusters by
the plateau method (A), the delta K method (B), inferred 3
clusters (C) and inferred 4 clusters (D)
Figure 1 Factor analysis showing grouping of the 407
individuals on axis 1 and 2


