Molecular Plant Breeding 2016, Vol.7, No.11, 1
-
16
6
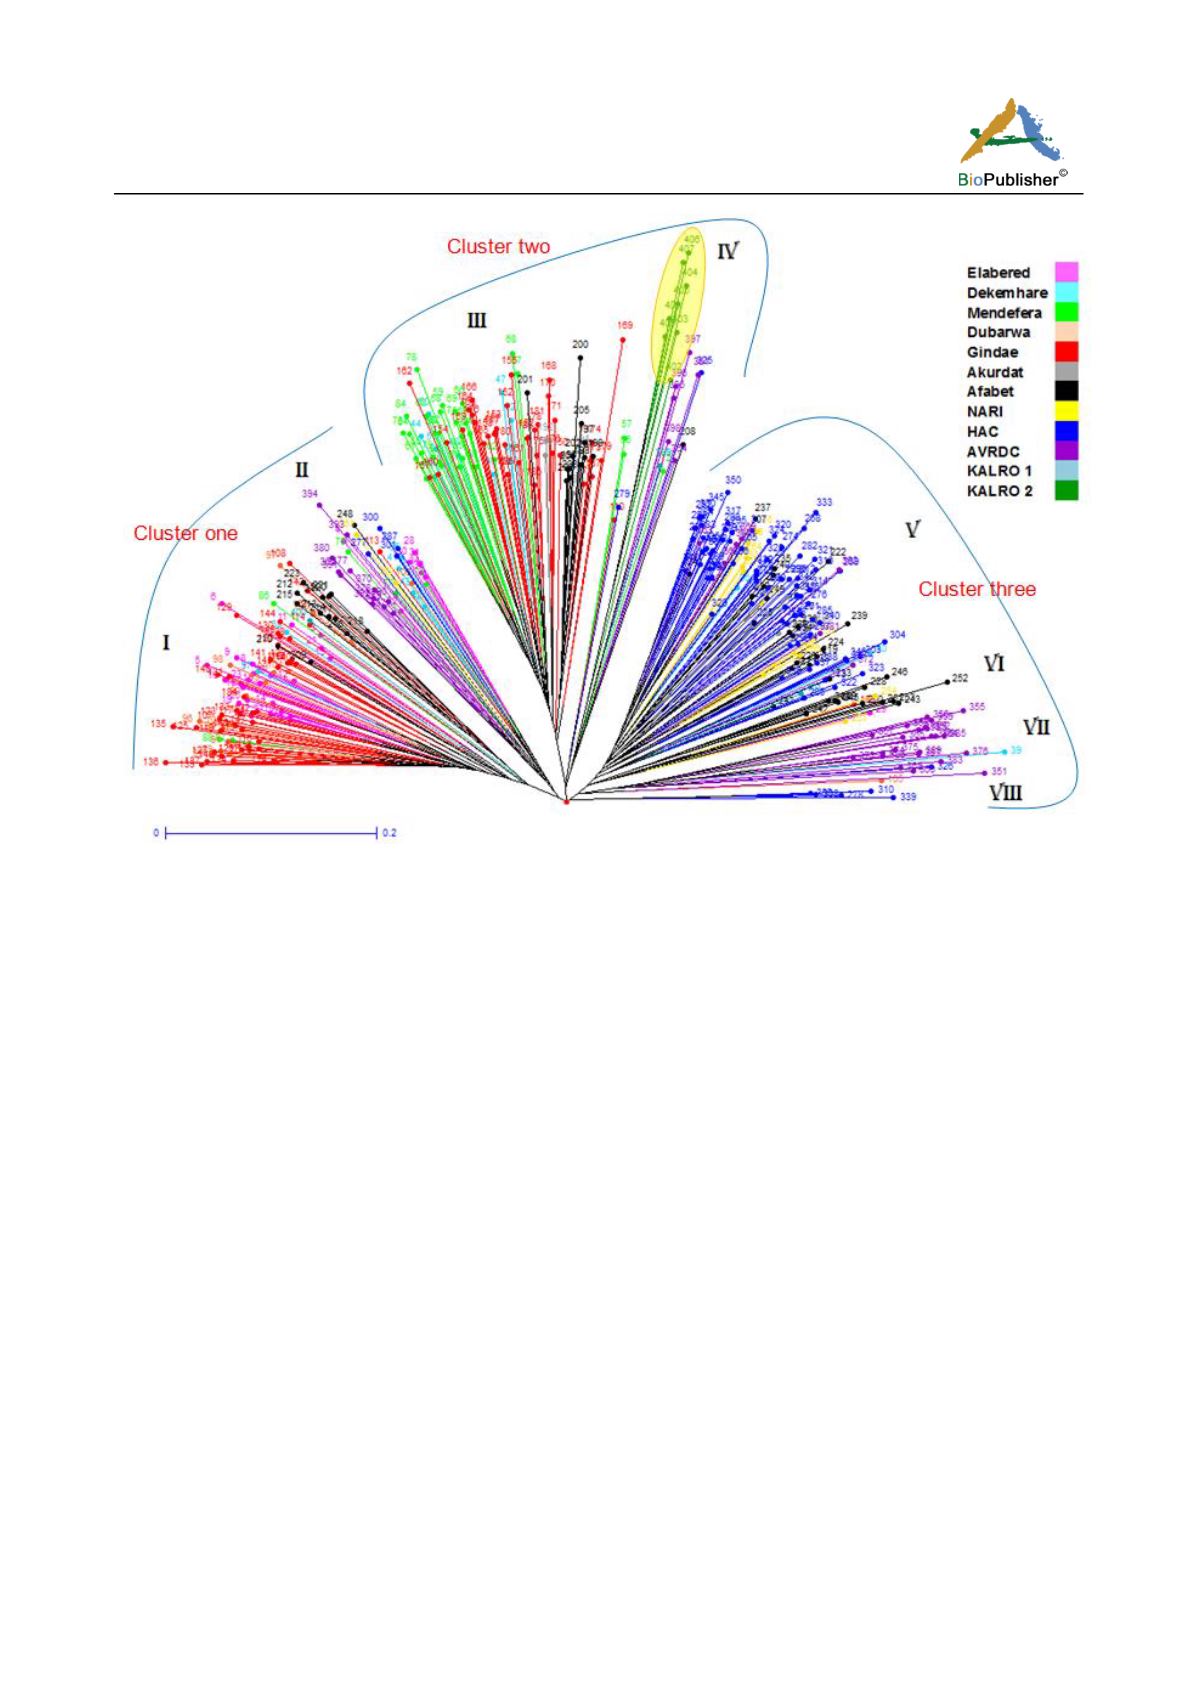
Figure 2 Neighbour joining tree showing clustering of the 407 individuals
According to the model based structure (Figure 3 and
Table 5), Afabet was the only population collected
from farmers that had most individuals (64%) inferred
in cluster 3, while 13 and 22% were inferred to
clusters 1 and 2 respectively. Most of the materials
from Dbarwa and Elabered (85 and 80% respectively)
inferred to cluster 1, while 15 and 19% from the
previous populations were inferred to cluster 3.
Majority of genotypes from Gindae and Akurdat
inferred to clusters 1 and 2 and cluster 2 and 3
respectively.
Only 7% of individuals from Gindae inferred to
cluster 3 and 1% from Akurdat inferred to cluster 1.
Half of the Dekemhare population was inferred in
cluster 2, while the remaining 50% was equally
divided between cluster 1 and 3 (Table 5). Cluster 1
consisted of 86 individuals collected from sub-regions
Gindae (39), Elabered (22) and Dbarwa (15) and few
genotypes from Mendefera (4), Dekemhare (2), Afabet
(3) and AVRDC (1). An admixture group of 36
genotypes was also found in this group. Cluster 2,
included 96 individuals, basically composed of
materials collected from Gindae (37) and Mendefra
(26), in addition to 12 from Afabet, 9 from Dekemhare
and 4 from Akurdat. This cluster also contained all the
8 tomato outgroup genotypes. The admixed group of
this cluster was very small compared to the other two
clusters. Cluster 3 was the largest and comprised 188
individuals and an admixed group of 36 individuals.
This cluster comprised genotypes from the 11
sub-populations, however, the major constituents are
materials from HAC, AVRDC, NARI and sub-region
Afabet. Of the total number of genotypes collected
from HAC, 80 inferred to this cluster. Similarly, 13
from NARI and 42 from AVRDC and 35 from Afabet
inferred to this cluster. Other individuals included 3
each from Elabered, Dekemhara, Gindae, Akurdat and
Mendefera, 2 from KALRO1 and 1 from Dbarwa.
Expanding the number of clusters to 4 resulted in
moving 63% of AVRDC, 51% of KALRO1 and 82%
of KALRO2 populations to form its own cluster.
Ancestry of the first two populations in cluster 1
remained almost similar, 9% for AVRDC and 24% for
KALRO1 compared to the previous 8% and 21%
respectively, while for KALRO2 it declined from
7% to 4%. However, both AVRDC and KALRO1


