Molecular Plant Breeding 2015, Vol.6, No.21, 1
-
17
10
Chart:
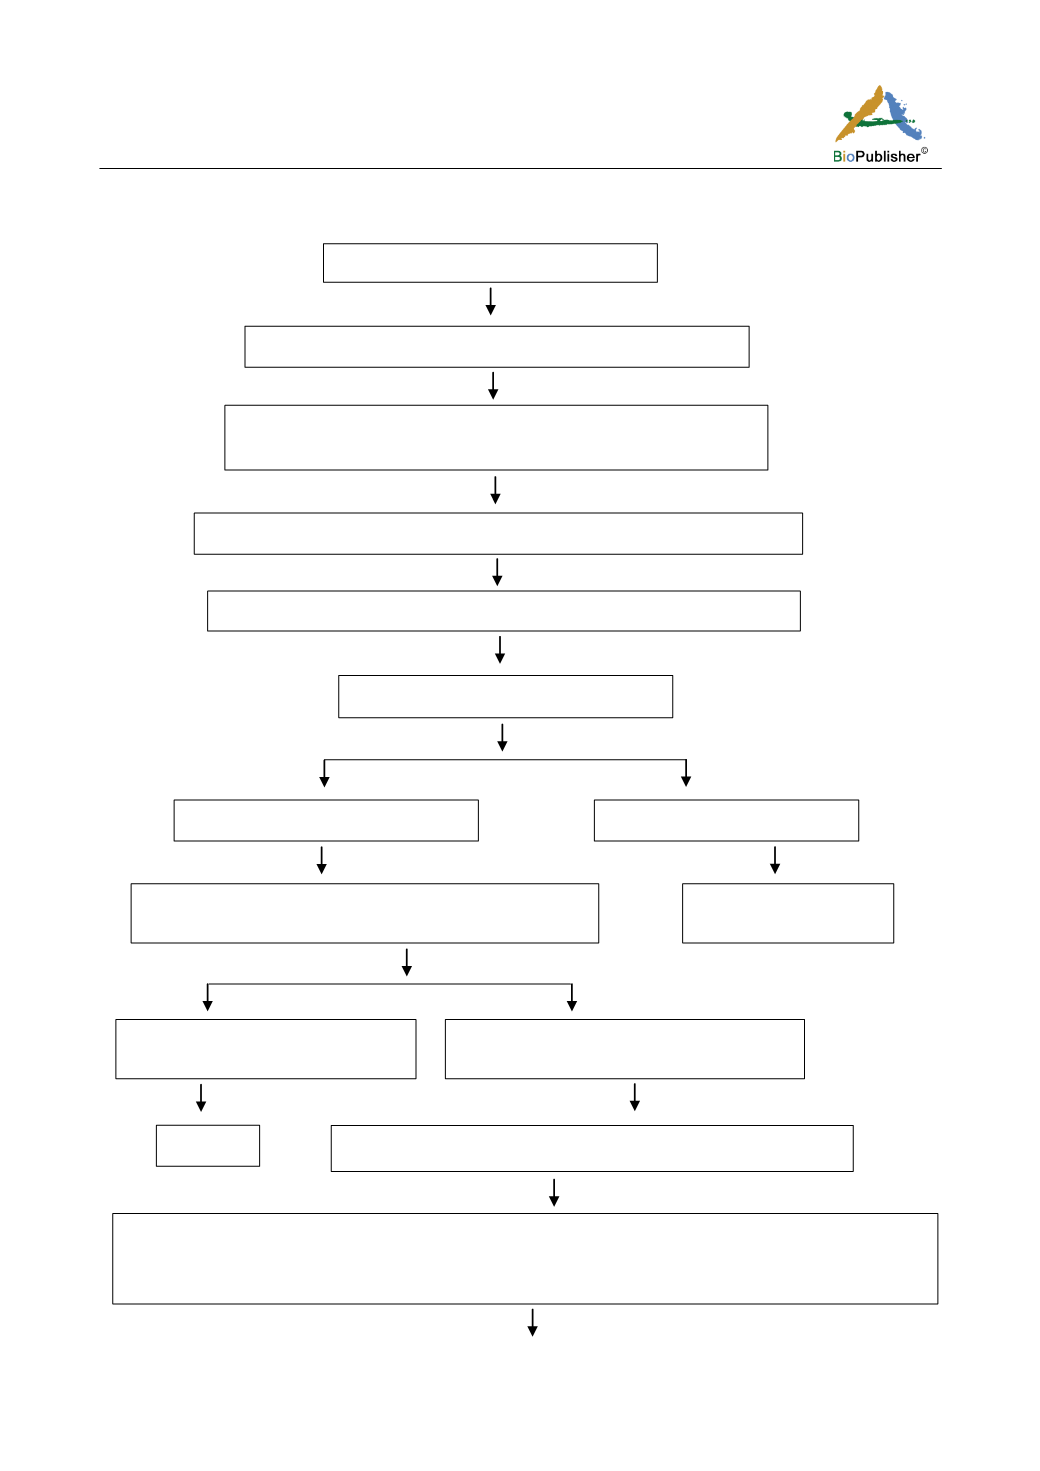
the procedure for wheat variety uniformity assessment on the basis of seed purity and SSR-HLRs
Samples of wheat varieties
DNA isolation from 100 individuals for each variety
Genotype individuals using 30 SSR markers
(Labeled by * in Table 4 and include 21 first-grade markers)
Discrimination of contaminant individuals from non-homozygous SSR loci
Count the number of contaminant individuals in each variety
Calculate seed purity
Varieties with seed purity > 95%
Varieties with seed purity ≤95%
No uniformity
(~10% in regional trail)
Confirmation of non-homozygous SSR loci on the basis of
the genotypes of 21 first-grade markers
Varieties with 21 homozygous loci
(~60 % in regional trials)
Varieties with ≥ one non-homozygous locus
(~30 % in regional trials)
Uniform
Take the DNA samples of 20 individuals for SSR-HLR detection
Detection of non-homozygous SSR loci using 29 second-grade markers (In fact, the data of nine of 29
second-grade markers has been gotten when seed purity was assessed. In this step, the other 20
second-grade markers are genotyped only.


