International Journal of Marine Science 2015, Vol.5, No.25, 1-9
5
Table 2 Concentration of heavy metals accumulation (µg g -1 dry wt.) in fishes collected from Pazhayar (unpolluted area)
Metal
Thalassoma
trilobatum
(mean±SD)
Parapercis
heropthalma
(mean±SD)
Saurida tumbil
(mean±SD)
Pseudorhompus
javanicus
(mean±SD)
Apogon
quadrifasciatus
(mean±SD)
Priacanthus
humrur
(mean±SD)
Stomias
spp.
(mean±SD)
Cd
0.12±0.01
0.14 ±0.05
0.13±0.02
0.08±0.02
0.12±0.01
0.15±0.02
0.13±0.01
Co
0.02±BDL
0.01±BDL
0.04±0.01
0.01±0.04
0.01±BDL
0.05±0.06
0.06±0.07
Cu
0.06±0.01
0.18±BDL
0.31±BDL
0.14±0.08
0.14±0.04
0.22±0.05
0.22±0.07
Fe
1.42±BDL
3.74±0.09
8.05±0.04
3.59±0.08
3.61±0.07
4.91±0.12
4.52±0.26
Mg
28.35±1.69
16.63±2.23
20.83±1.62
10.99±1.77
14.30±2.43
15.43±2.54
18.42±2.02
Mn
0.12±0.04
0.14±0.06
0.54±0.41
0.15±0.09
0.25±0.23
0.24±0.14
0.32±0.27
Ni
0.10±0.09
0.04±0.02
0.06±0.04
0.04±0.04
0.09±0.09
0.04±0.03
0.07±0.06
Pb
0.26±0.16
1.05±1.26
0.27±0.09
0.19±0.08
0.22±0.14
0.19±0.01
0.20±0.06
Zn
1.02±0.09
1.09±0.01
1.54±0.05
0.88±0.09
0.93±0.12
1.52±0.13
1.31±0.04
Al
1.30±0.05
1.85±0.14
3.77±0.11
1.41±0.05
1.51±0.11
1.89±0.13
2.49±0.08
Cr
0.28±0.03
0.59±0.03
1.19±0.01
0.37±0.03
0.69±0.06
0.48±0.03
0.45±0.05
B
0.39±0.02
0.30±0.01
0.38±0.03
0.25±0.05
0.18±0.01
0.25±0.02
0.28±0.01
Note: BDL: below detectable level
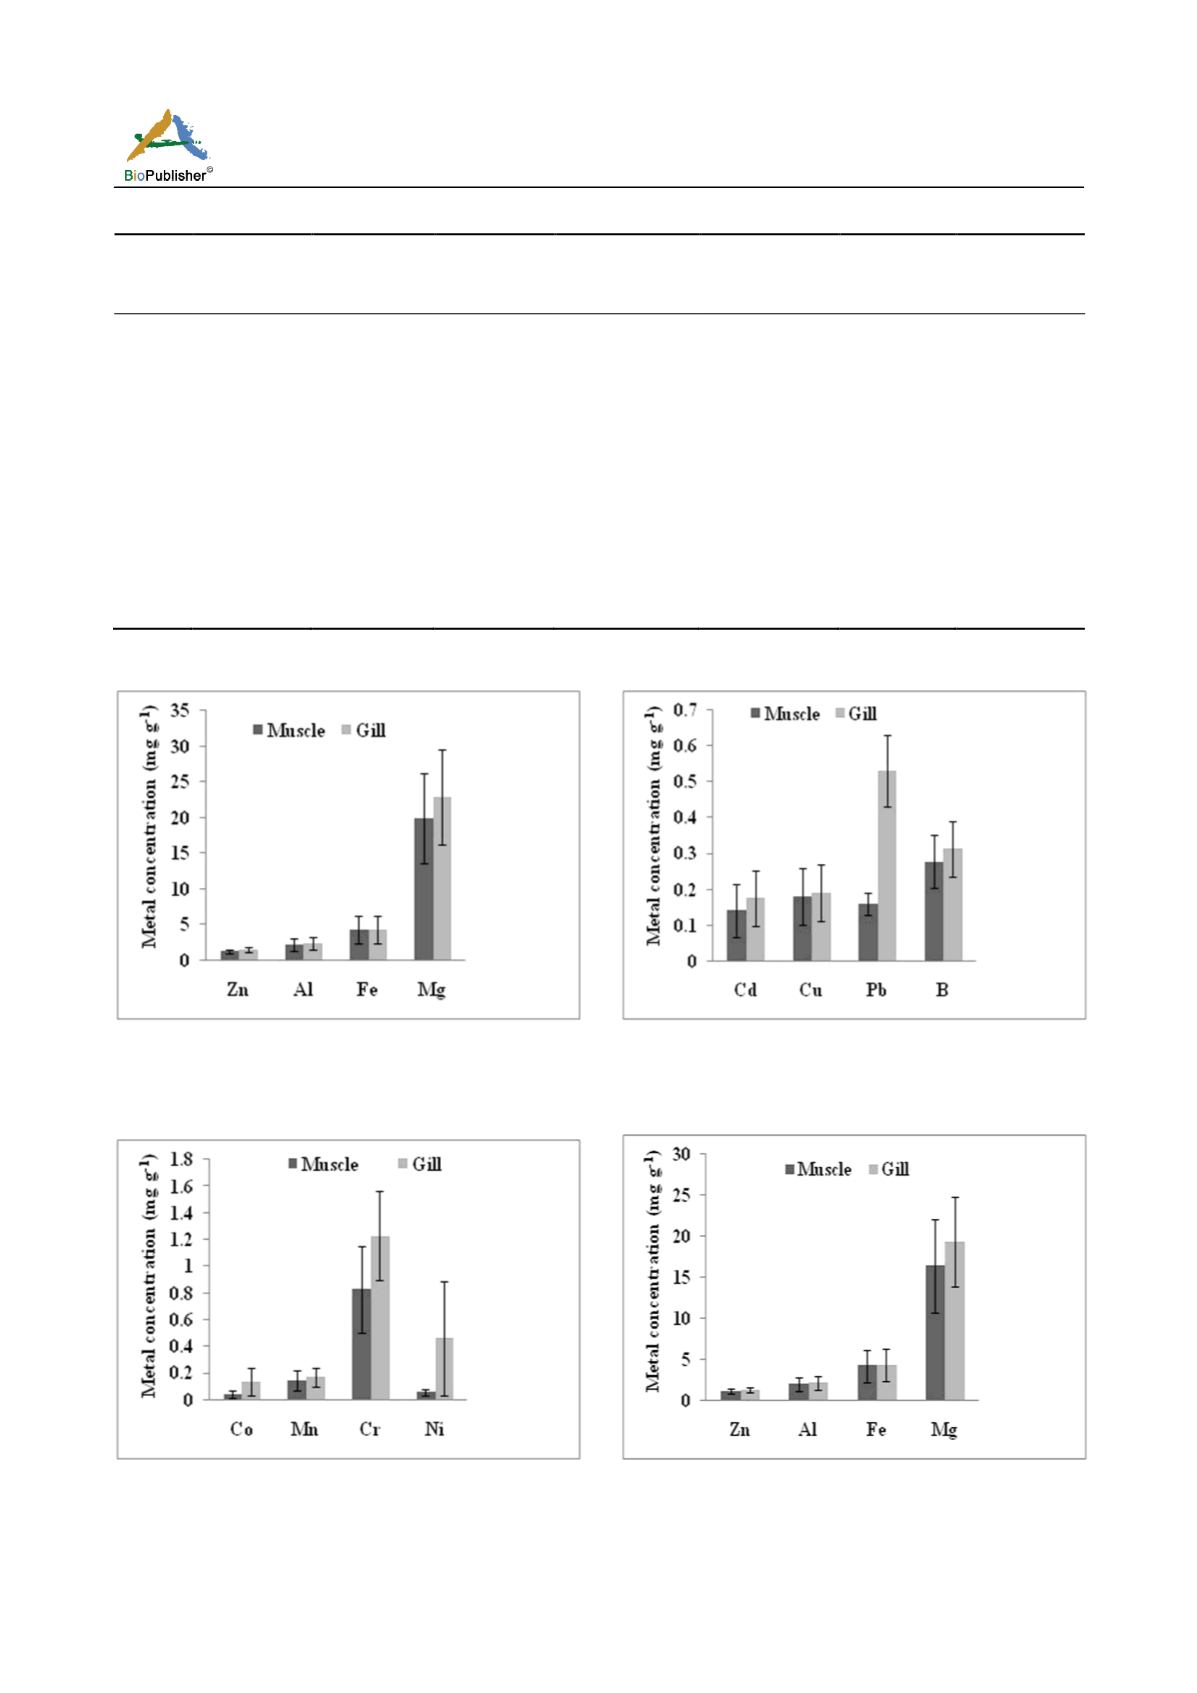
Figure 4b Comparison of mean concentrations (±SD) of Zn, Al,
Fe and Mg (mg g
-1
dry wt) between muscle and gill tissues of
fishes. Bars represent mean and vertical lines the SD
、
Figure 4c Comparison of mean concentrations (± SD) of Co,
Mn, Cr, and Ni (mg g
-1
dry wt) between muscle and gill tissues
of fishes. Bars represent mean and vertical lines the SD
Figure 5a Comparison of mean concentrations (± SD) of Cd,
Co, Pb and B (mg g
-1
dry wt) between muscle and gill tissues
of fishes. Bars represent mean and vertical lines the SD
Figure 5b Comparison of mean concentrations (±SD) of Zn, Al,
Fe, and Mg (mg g
-1
dry wt) between muscle and gill tissues of
fishes. Bars represent mean and vertical lines the SD


