International Journal of Marine Science 2015, Vol.5, No.25, 1-9
4
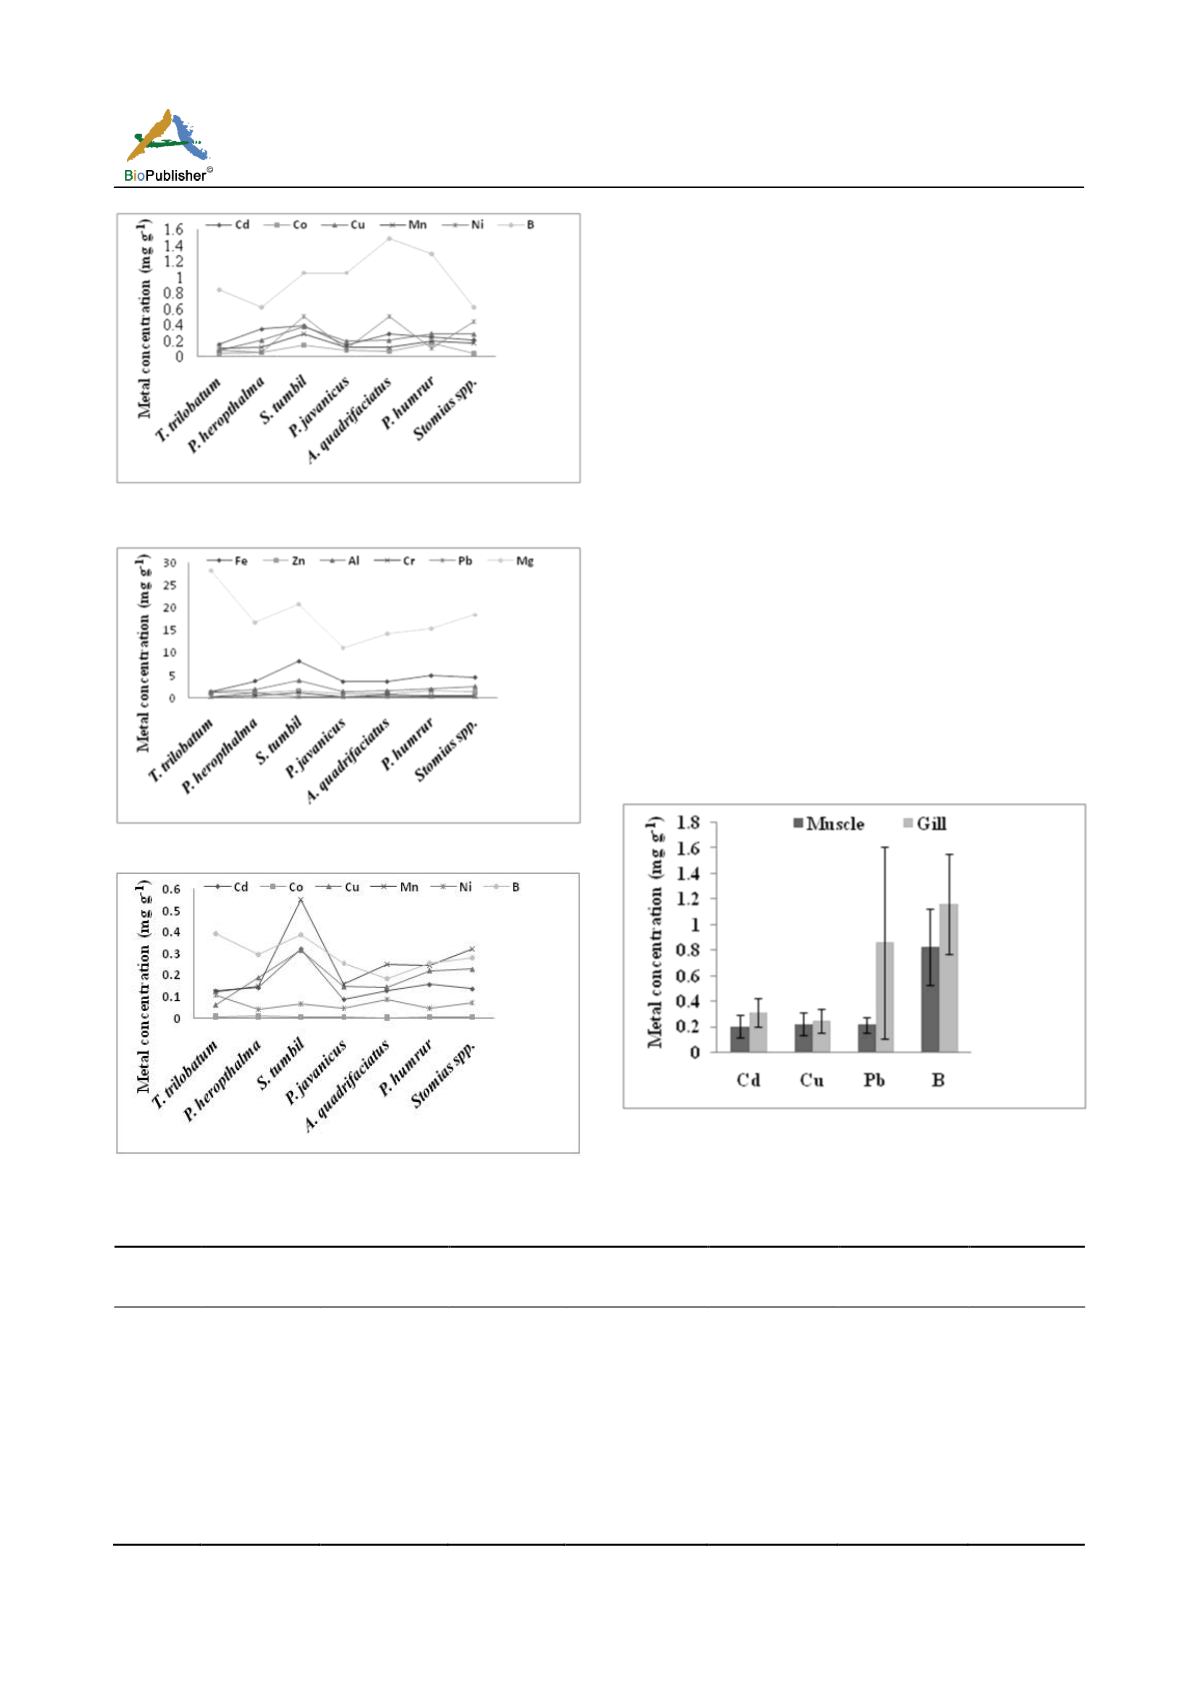
Figure 2b Levels of Cd, Co, Cu, Mn, Ni and B (µg g
-1
) in fishes
Figure 3a Levels of Fe, Zn, Al, Cr, Pb and Mg (µg g
-1
) in fishes
Figure 3b Levels of Fe, Zn, Al, Cr, Pb and Mg (µg g
-1
) in fishes
Metal concentrations and the corresponding mean
standard deviations (µg g
-1
dry wt) were measured in
gill and muscle tissues for all trash fishes of both
landing centre (Figure 4a-c and 5a-c).
All the metals
were found highly accumulated in gills than the
muscle. Mean trace metal levels of different fishes
were given in Table 3-4. Average cadmium, cobalt,
copper, iron, magnesium, manganese, nickel, lead,
zinc, aluminum, chromium and boron concentrations
were found to be viz, 0.07-0.40, 0-0.32, 0.06–0.37,
1.42–8.12, 9.74–33.1, 0.08–0.84, 0.01–0.97, 0.12–2.05,
0.81–2.11, 1.26-3.98, 0.25-1.76 and 0.17-1.87 µg g
-1
dry wt. respectively.
Cadmium is a serious contaminant, a highly toxic
element, which is transported to sea through air. The
limit of Cd for human consumption of fish is
approximately 0.5 µg g
-1
dry wt. (CSHPF, 1995).
Mean concentrations of cadmium were ranged from
0.07-0.40 µg g
-1
and it showed highest level in gill
than the muscle tissues but higher than maximum
Figure 4a Comparison of mean concentrations (± SD) of Cd,
Cu, Pb and B (mg g
-1
dry wt) between muscle and gill tissues
of fishes. Bars represent mean and vertical lines the SD
Table 1 Concentration of heavy metals accumulation (µg g -1 dry wt.) in fishes collected from Cuddalore (polluted area)
Metal
Thalassoma
trilobatum
(mean±SD)
Parapercis
herophthalma
(mean±SD)
Saurida
tumbil
(mean±SD)
Pseudorhompus
javanicus
(mean±SD)
Apogon
quadrifasciats
(mean±SD)
Priacanthus
humrur
(mean±SD)
Stomias
spp.
(mean±SD)
Cd
0.15±0.02
0.34±0.14
0.39±0.01
0.14±0.06
0.28±0.16
0.24±0.09
0.21±0.04
Co
0.03±0.02
0.05±0.03
0.13±0.13
0.07±0.02
0.06±0.07
0.17±0.21
0.03±0.02
Cu
0.08±0.01
0.20±0.05
0.37±0.03
0.19±0.01
0.20±0.02
0.29±0.01
0.28±0.02
Fe
1.58±0.01
3.79±0.07
8.10±0.01
3.603±0.01
3.58±0.01
4.86±0.02
4.34±0.04
Mg
31.61±2.10
27.12±2.82
24.42±2.50
13.66±2.05
15.775±2.05
19.19±1.39
18.08±1.49
Mn
0.09±0.01
0.11±0.01
0.29±0.01
0.11±0.01
0.10±0.01
0.19±0.01
0.17±0.02
Ni
0.08±0.04
0.05±0.03
0.50±0.64
0.09±0.06
0.49±0.67
0.10±0.02
0.43±0.51
Pb
2.05±1.87
0.39±0.57
0.27±0.02
0.39±0.17
0.17±0.03
0.25±0.05
0.80±0.71
Zn
1.04±0.10
1.62±0.68
1.63±0.06
1.14±0.38
0.98±0.05
1.50±0.02
1.30±0.01
Al
1.97±0.95
1.88±0.14
3.87±0.15
1.61±0.077
1.72±0.09
1.72±0.37
2.82±0.07
Cr
1.11±0.92
0.93±0.23
1.16±0.40
0.77±0.29
1.27±0.40
0.88±0.14
1.04±0.39
B
0.84±0.39
0.62±0.23
1.05±0.25
1.05±0.09
1.48±0.54
1.28±0.07
0.62±0.07
Note: BDL: below detectable level


