International Journal of Marine Science, 2017, Vol.7, No.2, 8-18
13
average 18.4 ppt during 2004-2005 (Gharib, 2006). Recent measurements of the salinity during this study in 2015
indicated that the salinity of last part of Rashid Estuary until 1.5 km turned to marine water with average 39.54 ppt.
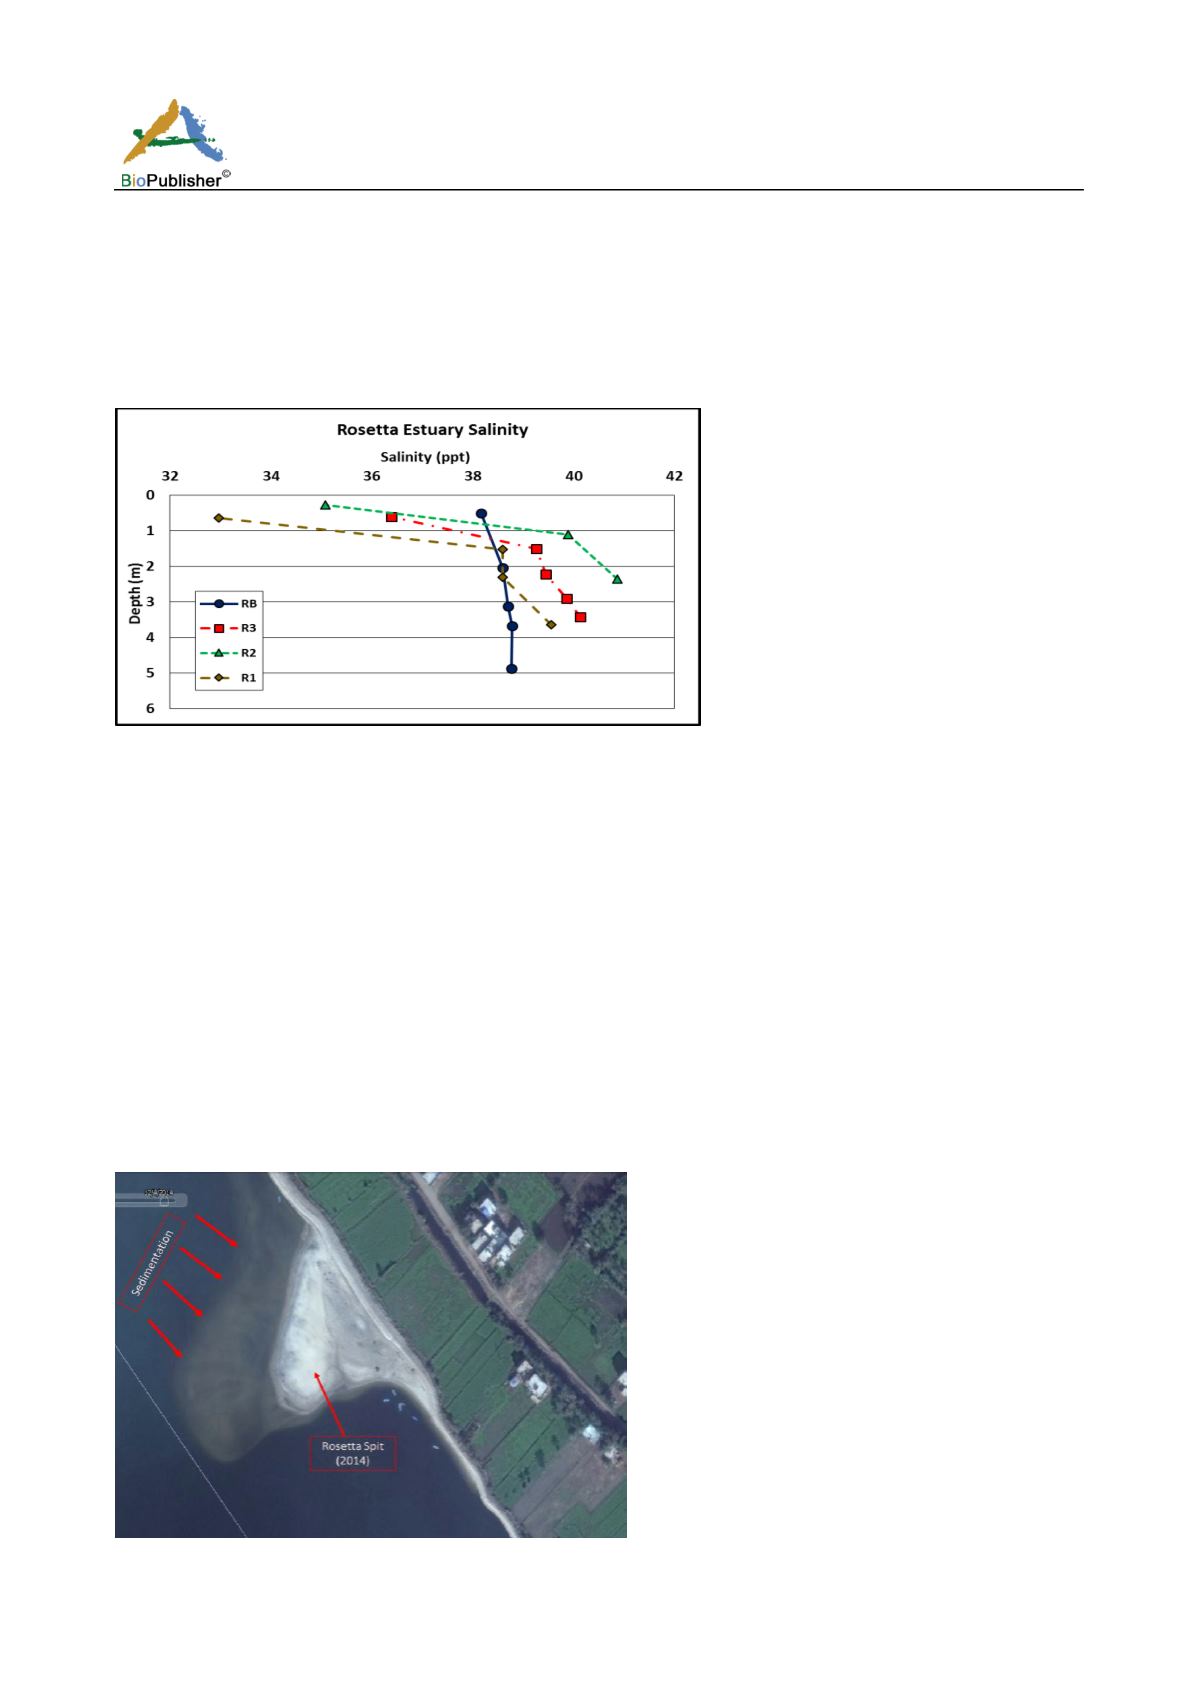
Within the estuarine water column, the measurement of salinity revealed variation that the upper water layers have
relatively lower salinity than the middle and the bottom layers but still all are recognized as saline water as shown
in Figure 6. This indicated that the seawater entered to Rosetta Estuary instead of the river fresh water due to the
reduction of the flow of river water after the construction of Aswan High Dam and the river hydraulic structures
such as barrages.
Figure 6 Salinity profiles in the middle sites of Rosetta Estuary at Distances; in front of the estuary, 0.5, 1 and 1.5 km from the outlet
during March 2015
Increase of salinity of the Rosetta Estuary my affect the adjacent agricultural area. Salt-water could be introduce
as leakage into the agricultural land around. Saline resistant plant only can tolerate and grow under the increase of
salinity.
One of the adverse effects of the entrance of the marine water to the Rosetta Estuary in conjunction with the wave
attack, the rocks of the side border of the estuary at Borg Meghazil site was collapsed. An project was set to repair
the side border of the estuary by the Authority of Shore Protection with consultation of Coastal Research Institute.
2.2.3 Limitation of sediments flow with river water to Rosetta Estuary
Seawater with loss of its kinetic energy to transport sediment can deposit and build up layers of sediment via
gravity. Deposition occurs when the forces responsible for sediment transportation are no longer sufficient to
overcome the forces of particle weight and friction, creating a resistance to motion. The main direction of
sedimentation is obvious as in Figure 7 from North West to inside the Rosetta Estuary. It shows the submerged
sedimentation north of the spit during 2014.
Figure 7 The submerged sediments indicated the direction of sedimentation to grow the Rosetta Estuary internal spit during 2014
Note: The coordination of the spit is 31°27.26
’
N and 30°22.61
’
E


