International Journal of Horticulture, 2016, Vol.6, No.2, 1-10
6
accessions. In the present investigation, the most divergent genotype pair exhibiting highest genetic distance
between them was identified to be J 6 and H 6 (S.I=0.37). Besides, high level of genetic distance was revealed
also in case of genotype pair A62 and H 6 (S.I=0.40); and A 62 and H 8 (S.I.=0.41). Samal et al. (2004) also
revealed genetic relatedness among cashew varieties using RAPD markers.
Similarity index values of parent varieties constituting cashew nut hybrids can be considered as a basis to reveal
the extent of genetic variation among .the cashew hybrids. Cashew hybrids H 6 and D 19 maintained very high
level of average genetic dissimilarity with rest of the test genotypes (0.49 and 0.50). The most divergent high
yielding hybrids e.g., H 6 and D 19 were derived from the cross combination of M 44/3 with Kalyanpur Bold Nut
and VTH 711/4 respectively. This could be attributed to the fact that the above two specific parental combinations
had minimum
inter se
genomic homology (S.I. = 0.50-0.51) leading to produce heterotic hybrids (H 6 and D 19).
However, Archak et al. (2003) reported no correlation between molecular data and the pedigree of the varieties.
Besides, the cashew hybrids e.g., D19, H6, G8, B27, A71, H8 and C30 were shown to be genetically distant from
their respective parents. These can be sorted out as genetically superior elite hybrids (Asolkar et al., 2011) at even
seedling stage.
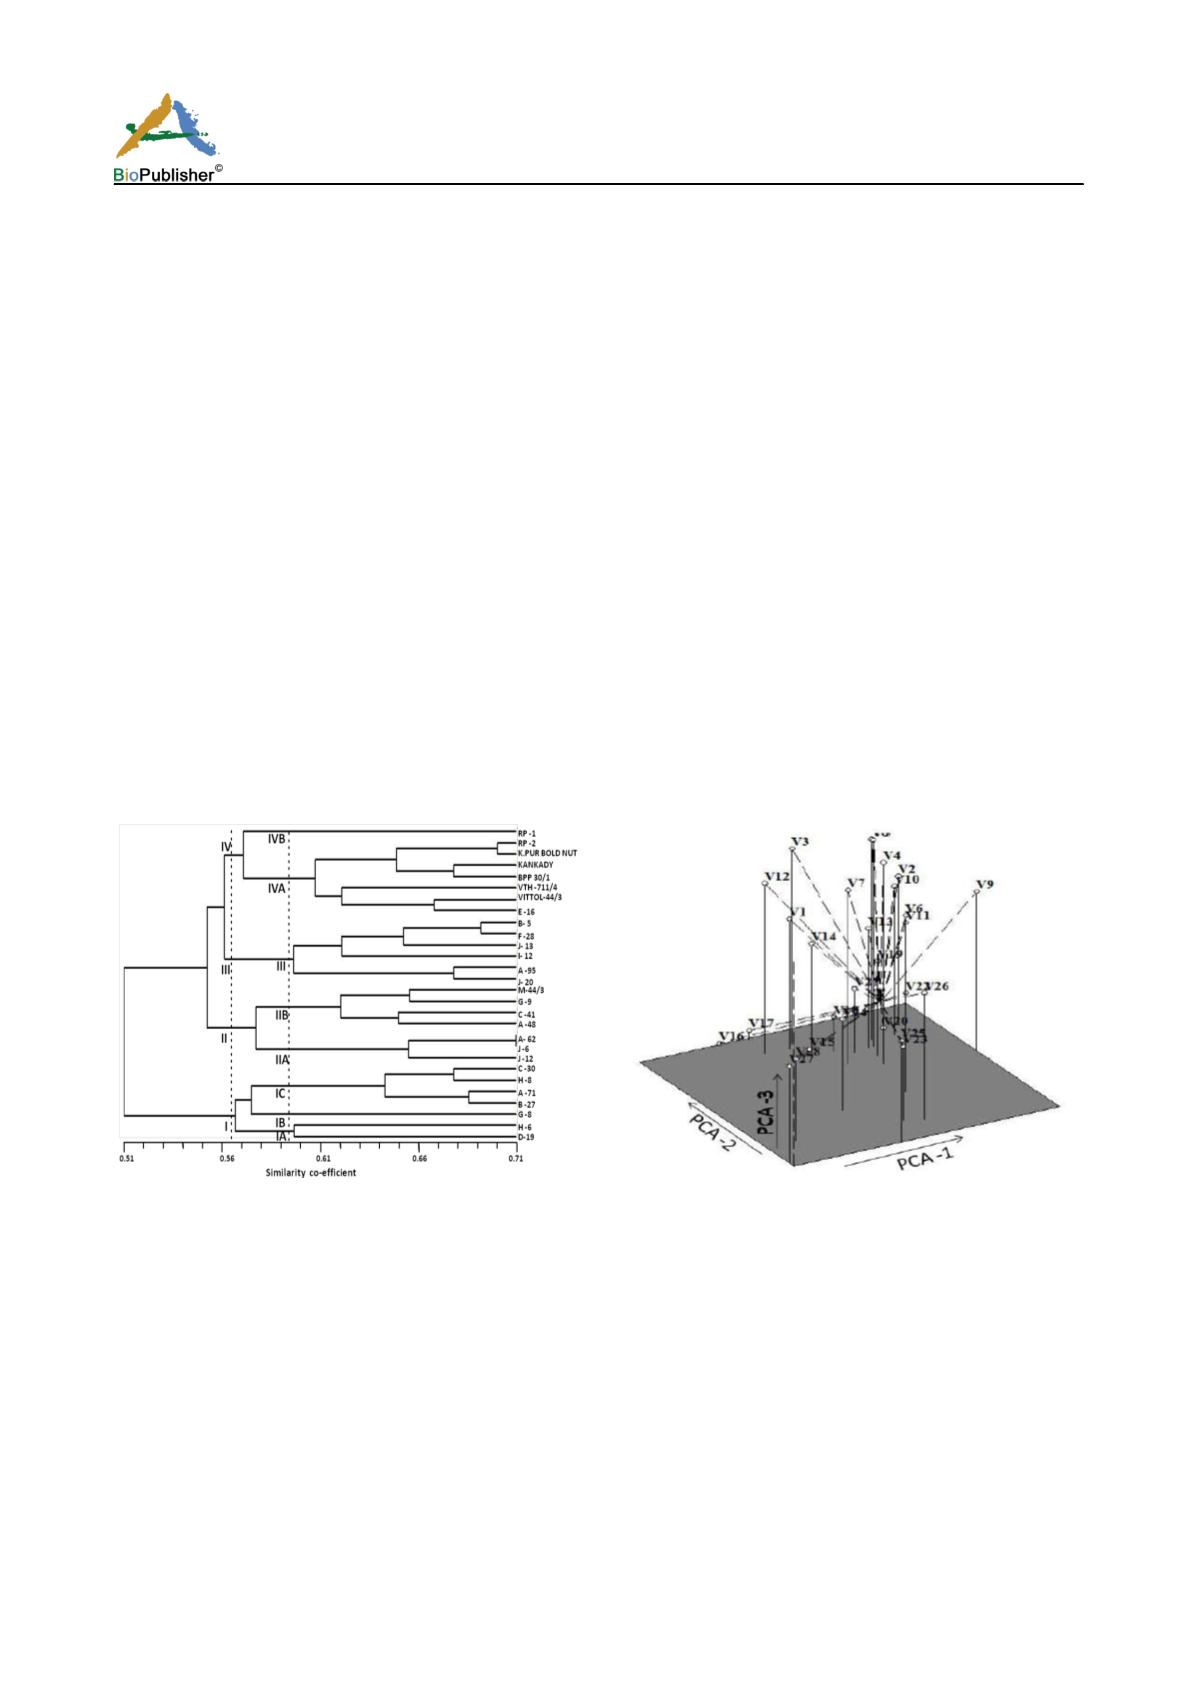
The whole range of fifteen RAPD primer- based UPGMA clustering of 28 cashew test genotypes revealed
hierarchical separation of four distinct genetic clusters at 56.5% phenon level (Figure 2). Among the test
genotypes, seven cashew hybrids e.g., D 19, H 6, G 8, B27, A 71, H 8 and C 30 were initially separated as a broad
genetic divergent group ‘Cluster I’ from rest of the genotypes at even 51% phenon level. Three dimensional
scaling based on Principal Co-ordinate Analysis (PCA) (Figure 3) also revealed similar clustering pattern. This
corroborated with the findings of Malik et al., 2013).
Figure 2 Dendrogram showing genetic diversity of 20
promising cashew hybrids and their parents (RP 1, RP 2,
Kalyanpur bold nut, Kankady, BPP30/1, VTH 711/4, Vittol
44/3 and M44/3) based on RAPD profiles
Figure 3 Three dimensional scaling (with vectors) of principal
co-ordinates 1, 2 and 3 using RAPD markers
Cluster I was further sub-divided into three sub-clusters (Cluster IA, Cluster IB and Cluster IC). Cashew hybrids
D 19 and H 6 constituting Cluster IA may be considered most divergent followed by G 8 included in Cluster IB;
and cashew hybrids B27, A 71, H 8 and C 30 forming Cluster IC. Rest 21 cashew test genotypes were grouped
into three distinct clusters e.g., Cluster II, Cluster III and Cluster IV. Cluster II and Cluster IV were shown to be
separated into two sub-groups each at 59.3% phenon level.
Cluster IIA contained cashew hybrids e.g., J 12, J 6 and A 62. Among the test genotypes, J 6 and A 62 maintained
maximum
inter se
homology up to 71% beyond which these can be discriminated. Cluster IIB was shown to have
three cashew hybrids (A 48, C 41 and G 9) and the parent genotype M 44/3. It is worth to note that Cluster IV is


