International Journal of Horticulture, 2017, Vol.7, No.3, 20-25
22
Table 1 Basic statistics of one hundred wheat accessions
Traits
Mean
Minimum
Maximum
Variance
SD
CV (%)
SE
Spike Length (cm)
12.23
6.50
21.90
5.19
2.28
18.63
0.22
Spikelets spike
-1
16.35
8.50
29.80
8.97
3.00
18.32
0.30
Grain yield plant
-1
2.36
1.26
4.58
0.27
0.52
21.89
0.05
1000-grain weight (g)
34.20
15.74
46.65
64.88
8.05
23.55
0.79
Grain yield (Kg/Ha)
4165
2610
5058
254467.06
504.45
12.11
49.70
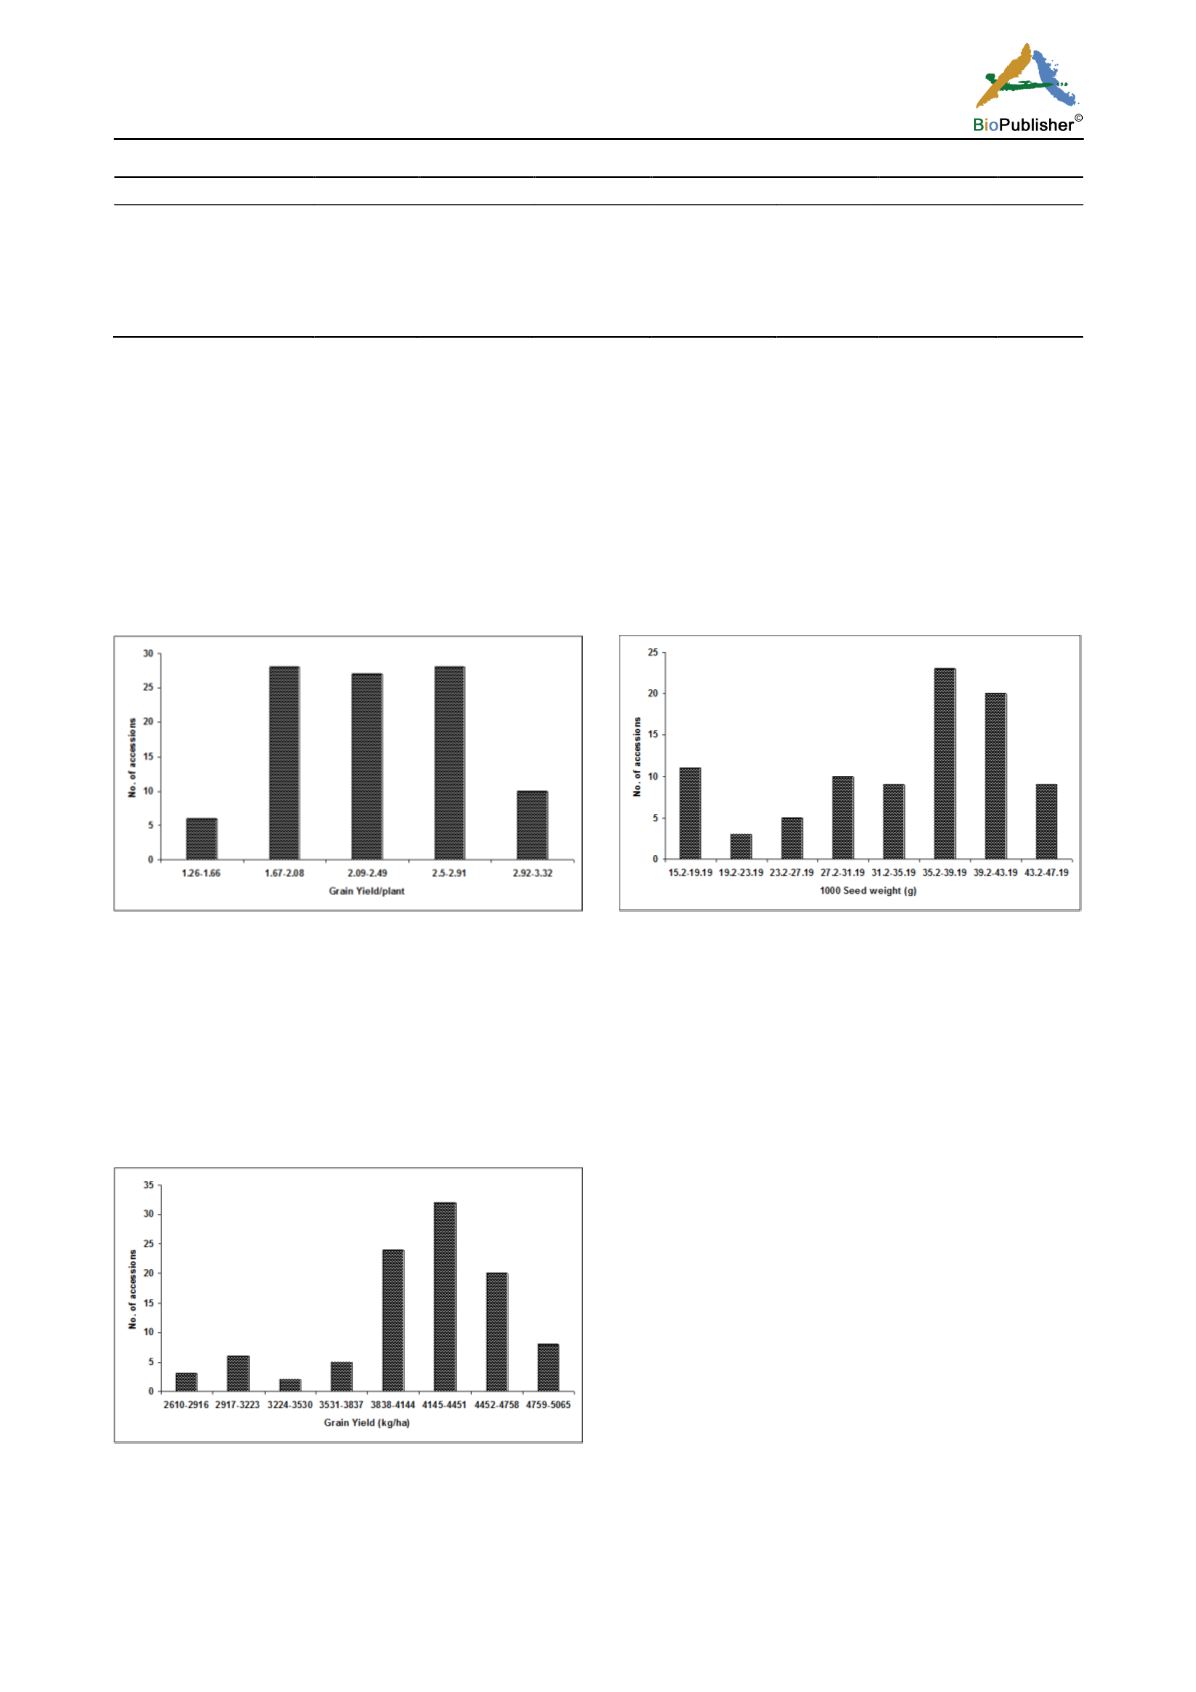
3.3 Grain yield plant
-1
(g)
Average grain yield plant
-1
of the wheat germplasms ranged considerably. The diversity for grain yield plant
-1
ranged from 1.26 to 4.58 (g) with mean value 2.36 ±0.52 and coefficient of variation for this character was
21.89 % (Table 1). Frequency distribution as depicted in (Figure 3) ranged from 1.26 to 3.32 (g).
3.4 1000-Grain weight (g)
The results of analysis depicts that significant variation in 1000-grain weight (g) was noted. It ranged from 15.74
to 46.65 g with mean value 34.20 ±8.05 g. While, coefficient of variation was 23.55%. The frequency distribution
for 1000 - grain weight (g) as represented in (Figure 4) depicts that 1000 - grain weight (g) varied between 15.20
and 47.19 (g).
Figure 3 Frequency distribution of grain yield plant-1 (g)
Figure 4 Frequency distribution of 1000-grain weight (g)
3.5 Grain yield (kg/ha)
Grain yield (Kg/Ha) is the most desirable trait for the identification and selection among wheat accessions for the
development of wheat varieties. From analyses the grain yield of one hundred accessions shows good variability.
The variation for grain yield (Table 1) ranged from 2610 to 5058 (Kg/Ha) with mean value 4165±504.45 (Kg/Ha)
and coefficient of variation 12.11%. Frequency distribution as depicted in (Figure 5) varied from 2610 to 5065.9
(Kg/Ha). The accession [PARC/MAFF 004353 (03)] intimates lowest grain yield (2610 Kg/Ha). While, the
accession [PARC/MAFF 004279 (05)] had a maximum grain yield (5058 Kg/Ha).
Figure 5 Frequency distribution of grain yield (Kg/Ha)
Result: Correlation coefficients
To analyse the combination among different plant traits is most important and needful for yield improvement.
Correlation among quantitative traits may depict biological process that is of considerable evolutionary interest.


