International Journal of Aquaculture, 2017, Vol.7, No.17, 112-121
116
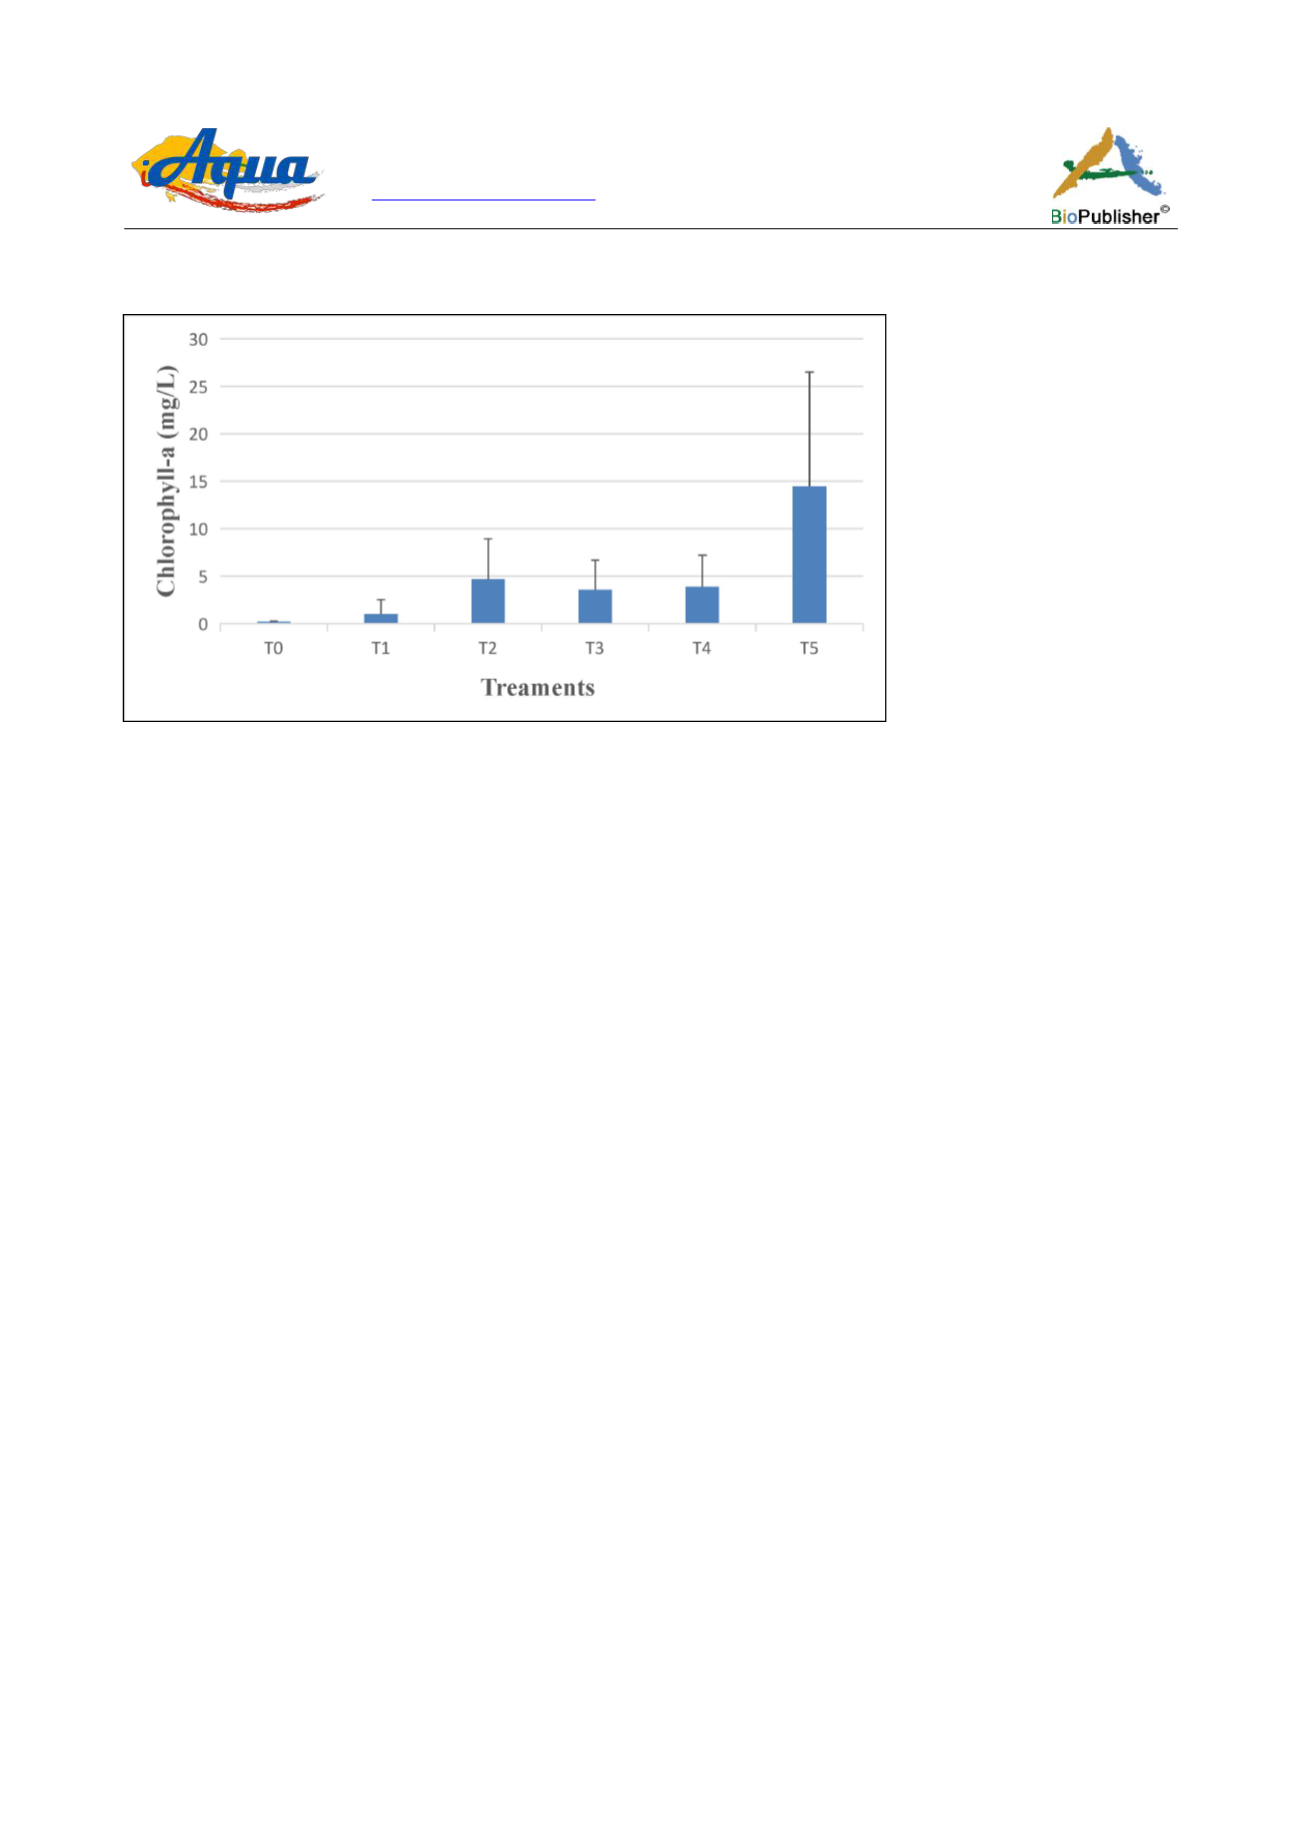
R² Adjusted = 0.76; F
(1, 16)
= 55.608; p<0.00) tested. These different phytoplankton biomasses could serve for
fresh water zooplankton development and indirectly for fish production.
Figure 4 Chlorophyll-a rate of different treatments
3.3 Density progression and phytoplankton production
Treatments T
2
and T
4
showed the best densities of zooplankton. Indeed, the density passed from 15 ind/L to
12,207 ind/L for rotifers (
Brachionus sp.
and
Asplanchna sp.
) and 3467 ind/L for eggie rotifers. There was a
significant difference among treatments (F
(7, 84)
= 41,685; p<0.00). Similarly, the density increased from 2 ind/L to
840 ind/L of cladocerans (
Moina sp.
and
Daphnia sp.
) with a significant difference (F
(7, 84)
= 738.18; p<0.00), but
there was no difference between T
0
and T
1
(p>0.00). Nauplii of copepods (
Thermocyclops sp.
) increased from 5
ind/L to 140 ind/L with a significant difference (F
(7, 84)
= 329.10; p<0.00) between T
2
and T
3
on the one hand, and
T
1
and T
0
and the other treatments on the other hand. However, there was no significant difference among T
2
, T
4
and T
5
(p>0.00). In addition, density of adult copepods (
Thermocyclops sp.
) increased from 4 ind/L to 260 ind/L
with a significant difference (F
(5, 12)
= 47.15; p<0.00) and followed the same progression trend as nauplii. Besides,
treatment T
0
(non-fertilized) presented a low density regarding different groups of zooplankton, what could be
explained by the impoverishment of the area in nutritive elements. Rotifers, adult copepods and cladocerans
reached their optimum at the 9
th
day while nauplii of copepods and eggie rotifers reached their optimum at the 6
th
day (Figure 5). The decrease of the density began on the 12
th
day in all treatments and the 9
th
day for nauplii and
eggie rotifers (Figure 5B; Figure 5D). Figure 5F presents the total density of zooplankton in different treatments.
3.4 Effect of treatment on the production and specific growth rates of zooplankton
Daily production of different group of zooplankton per treatment is reported in Table 2. Thus, the daily production
was higher in all fertilized treatments than in the control (T
0
) (p<0.05) (Table 2). The highest production was
obtained in treatment T
2
followed by T
4
(Table 2). This high production of different groups of zooplankton in T
2
revealed that this area offered the most suitable conditions to the development of these organisms. Specific growth
rates of different groups of zooplankton determined on the exponential growth stage are mentioned in Table 2.
Their comparison showed a high significant difference among treatments regarding rotifers (F
(5, 12)
= 6,568.6;
p=0.00), cladocerans (F
(5, 12)
= 25,705; p=0.00) and copepods (F
(5, 12)
= 3,586.5; p=0.00). The best specific growth
rates (µ) were obtained in treatment T
2
followed by T
4
(Table 2). From the multiple analysis of treatments effect
(test LSD of Fischer), it results that treatment T
2
followed by T
4
presented the best specific growth rates.
The supply of rabbit manure as organic fertilizer would be the source of this performance of zooplankton.


