International Journal of Aquaculture, 2017, Vol.7, No.17, 112-121
117
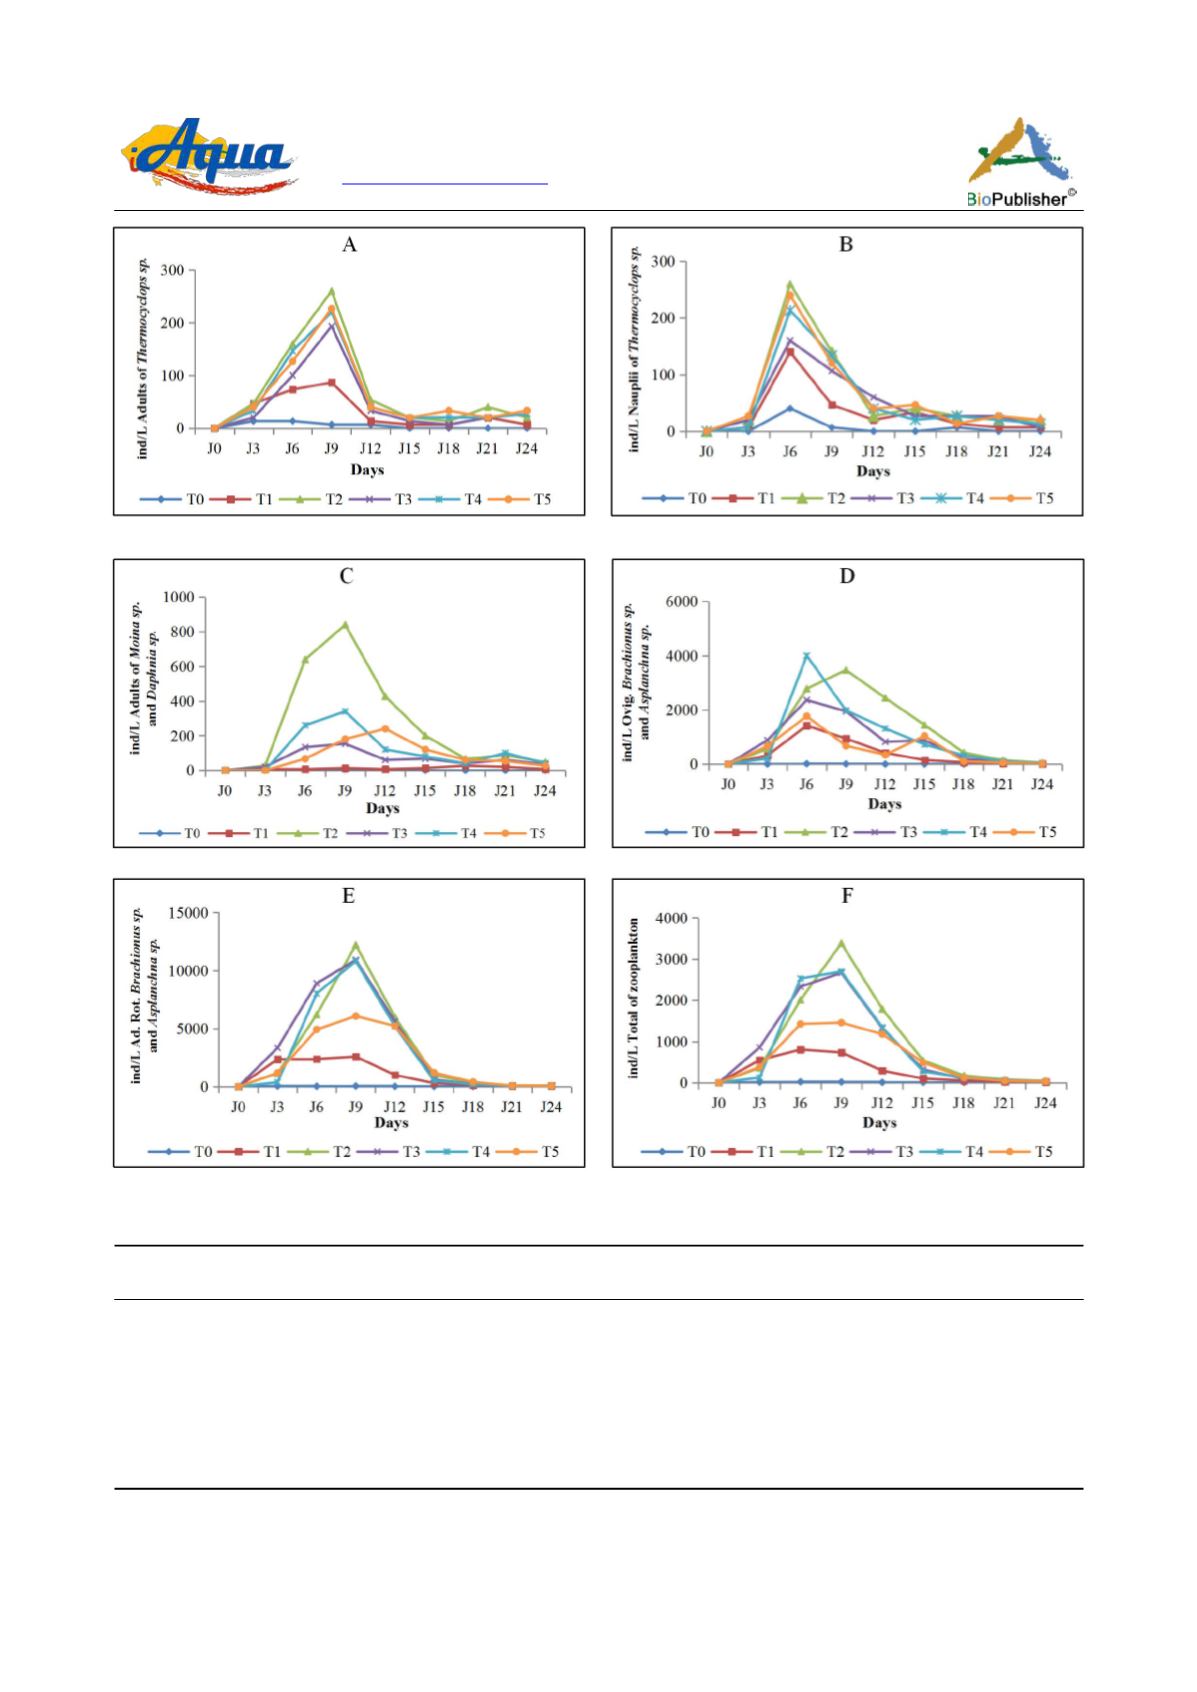
Figure 5 Variation of zooplankton densities in different treatments
Table 2 Production and specific growth rates of different groups of zooplankton
Traitements Rotifer
(
Brachionus sp
and
Asplanchna sp
.)
Cladoceran
(
Moina sp.
and
Daphnia sp.
)
Copepods
(
Thermocyclops sp.
)
P (ind/j)
µ (j
-1
)
R
2
P (ind/j)
µ (j
-1
)
R
2
P (ind/j)
µ (j
-1
)
R
2
T
0
2±0.48
0.10f
0.78
7±1.54
0.00ef
-0.10 7±11.54 0.00g
0.00
T
1
108±0.80
0.34e
0.90
13±1.54
0.00e 0.00
87±30.55 0.34f
0.99
T
2
509±1.27
1.48a
0.94
840±20
1.53a 0.82
260±20
1.28a
0.91
T
3
455±0.83
0.94c
0.87
153±30.55 1.09c 0.88
193±30.55 1.19b
0.92
T
4
451±1.27
1.30b
0.81
340±20
1.47b 0.97
220±20
0.89c
0.94
T
5
253±0.83
0.81d
0.84
180±20
0.54d 0.97
227±29.03 0.89ce
0.98
Note: µ = specific growth rate, R
2
= coefficient of correlation, P = daily production. Means followed by the same letter
are not significantly different (P>0.05) according to the LSD test of Fisher


