International Journal of Aquaculture, 2017, Vol.7, No.17, 112-121
114
following species representativeness (at least 100 individuals were counted) in 1-2 mL of sample that were
successively observed in a plastic saltcellar at densities that do not provoke overlapping among individuals.
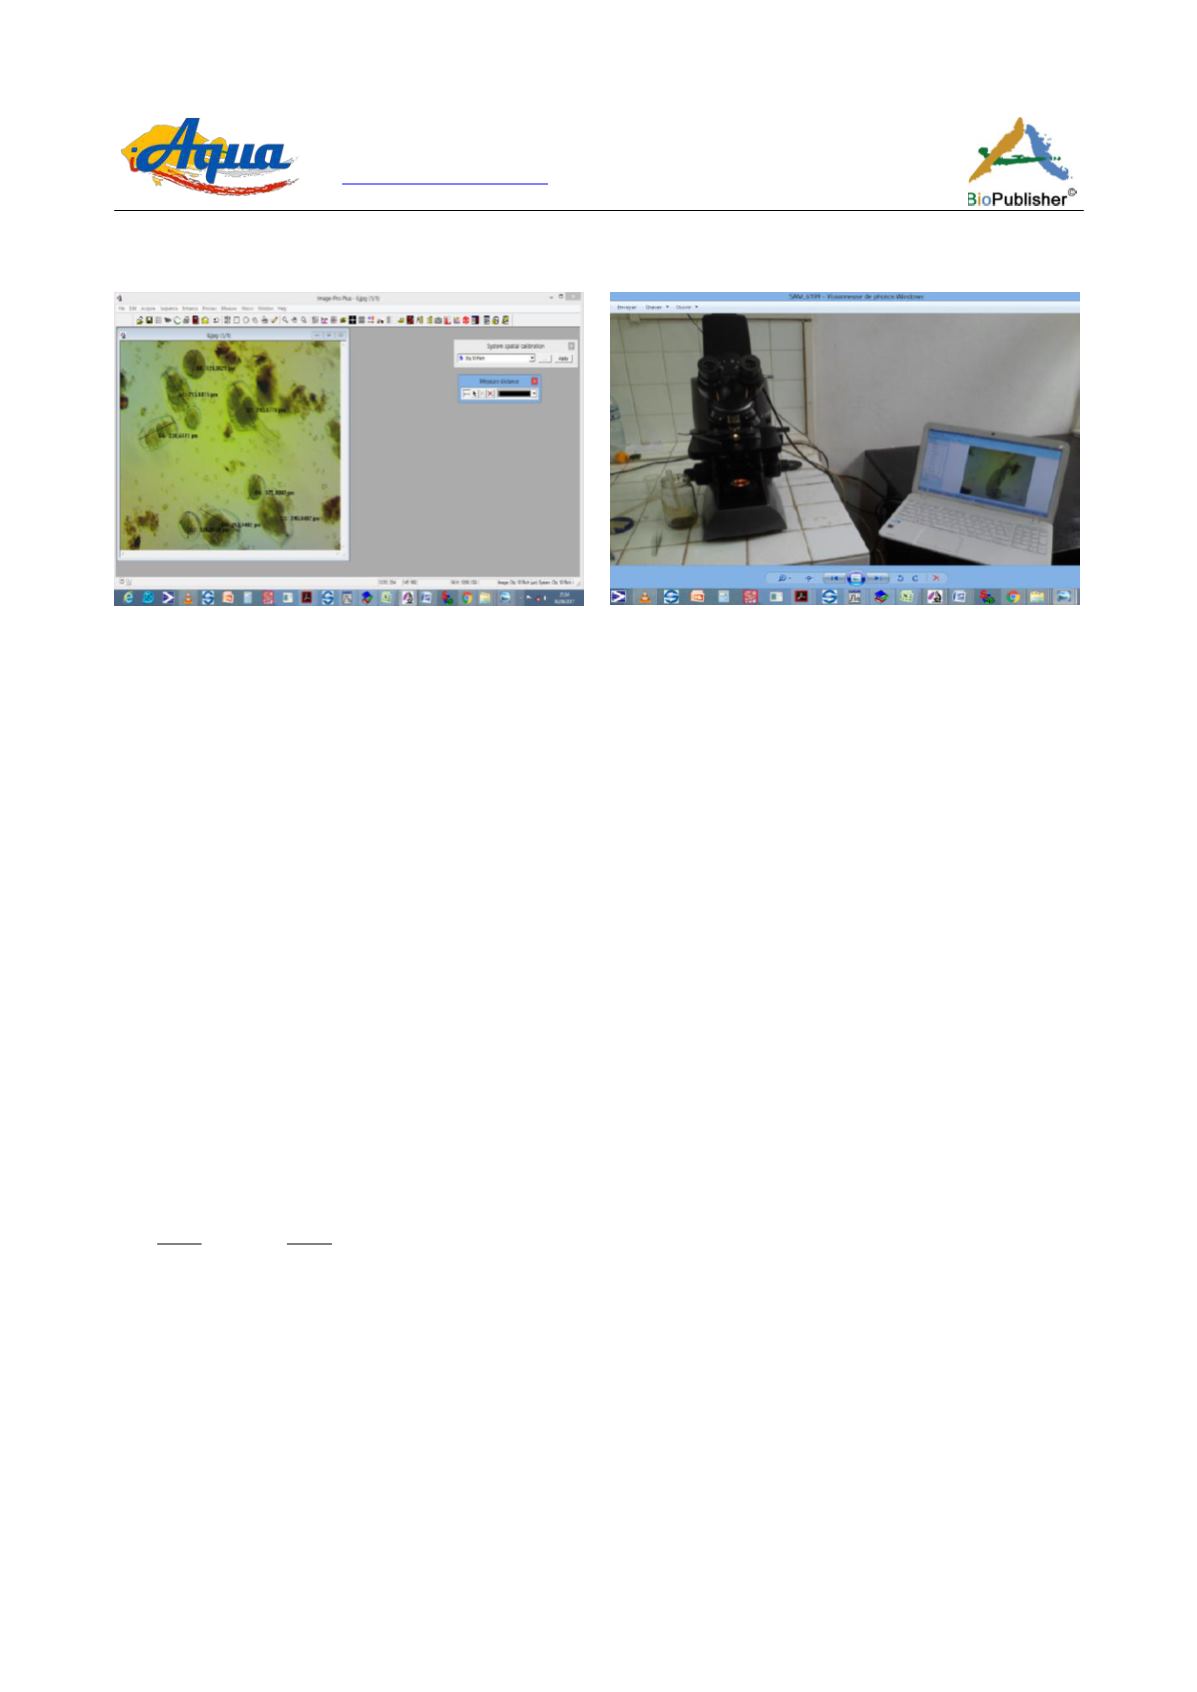
Figure 1 Zooplankton counting process
Figure 2 Technique of image capture
2.6 Physico-chemical and trophic parameters
During experiment, temperature, pH, conductivity and dissolved oxygen have been measured in situ every
sampling day at noon with a multi-parameter borer CALYPSO (Version Soft/2015, SN-ODEOA 2138) à ± 0.1°C
and by mg/L). At each sampling site, 500 mL of the culture was filtered per bucket on the one hand for dosage of
chlorophyll-a and for dosage of nutritive salts (ammonium, nitrate, nitrite and orthophosphate) on the other hand.
Dosage of chlorophyll-a was carried out according to SCOR-UNESCO (1966) while dosage of nutritive salts was
realized according to Rodier et al. (2016), with a spectrophotometer of molecular absorption (HACH DR/2800).
2.7 Comparison of different treatments performances
Performances of the six treatments were compared following two methods:
The first consisted to the comparison of different densities obtained in treatments; the second consisted to
compare specific growth rates of organisms during their exponential growth stage according to Liady et al. (2015).
In this second method, growth curves of zooplankton in non- renewed area presenting identical stages to those
observed in microorganism’s cultures in non-renewed area, identical mathematical laws were considered. Thus, in
each treatment, the exponential growth stage of density was considered and described by the formula (Waldbauer,
1968). From this formula, specific growth rate (µ) was determined by monitoring the progression of the logarithm
of the relative density as a function of the time; it corresponds to the slope of the straight line obtained.
2.8 Statistical analysis
From data collected, density (D) and daily production (P) were obtained respectively by using these equations:
D =
and P =
Where n = number of individuals counted; V
1
= volume of aliquot; V
2
= volume of sample concentrated; V
3
=
volume of water filtered; D
0
= initial population density; D
t
= population density at time t (in hour)
Collected data were analyzed using STATISTICA software (Statsoft inc., Tulsa, OK, USA). All significant levels
were fixed at P<0.05. The influence of treatments was studied using a one-way ANOVA; in case of need,
significance of differences among means was tested using the test LSD of Fisher.
3 Results
3.1 Water physico-chemical parameters
Different physico-chemical parameters of treatments varied strongly (Table 1 and Figure 3) during experiment
period except temperature and pH which remained relatively constant. By the same way, conductivity is high in
fertilized media with a significant difference among treatments (F
(5, 12)
= 33.92; p<0.00). Dissolved oxygen (DO)


