International Journal of Aquaculture, 2017, Vol.7, No.17, 112-121
115
is most important in treatments T
2
and T
5
followed by T
4
and T
3
compared to T
0
with a significant difference (F
(5,
12)
= 69.42; p<0.00) (Table 1). This oxygen concentration shows the photosynthetic activity of algae and
consequently their presence in culture media. Moreover, salinity and TDS followed the same trend with a
significant difference between T
0
and the other treatments respectively (F
(5, 12)
=11.60; p<0.00 and F
(5, 12)
= 7.79;
p<0.00). Besides, the high value of transparency of Secchi’s disk in treatment T
0
contrary to others explained
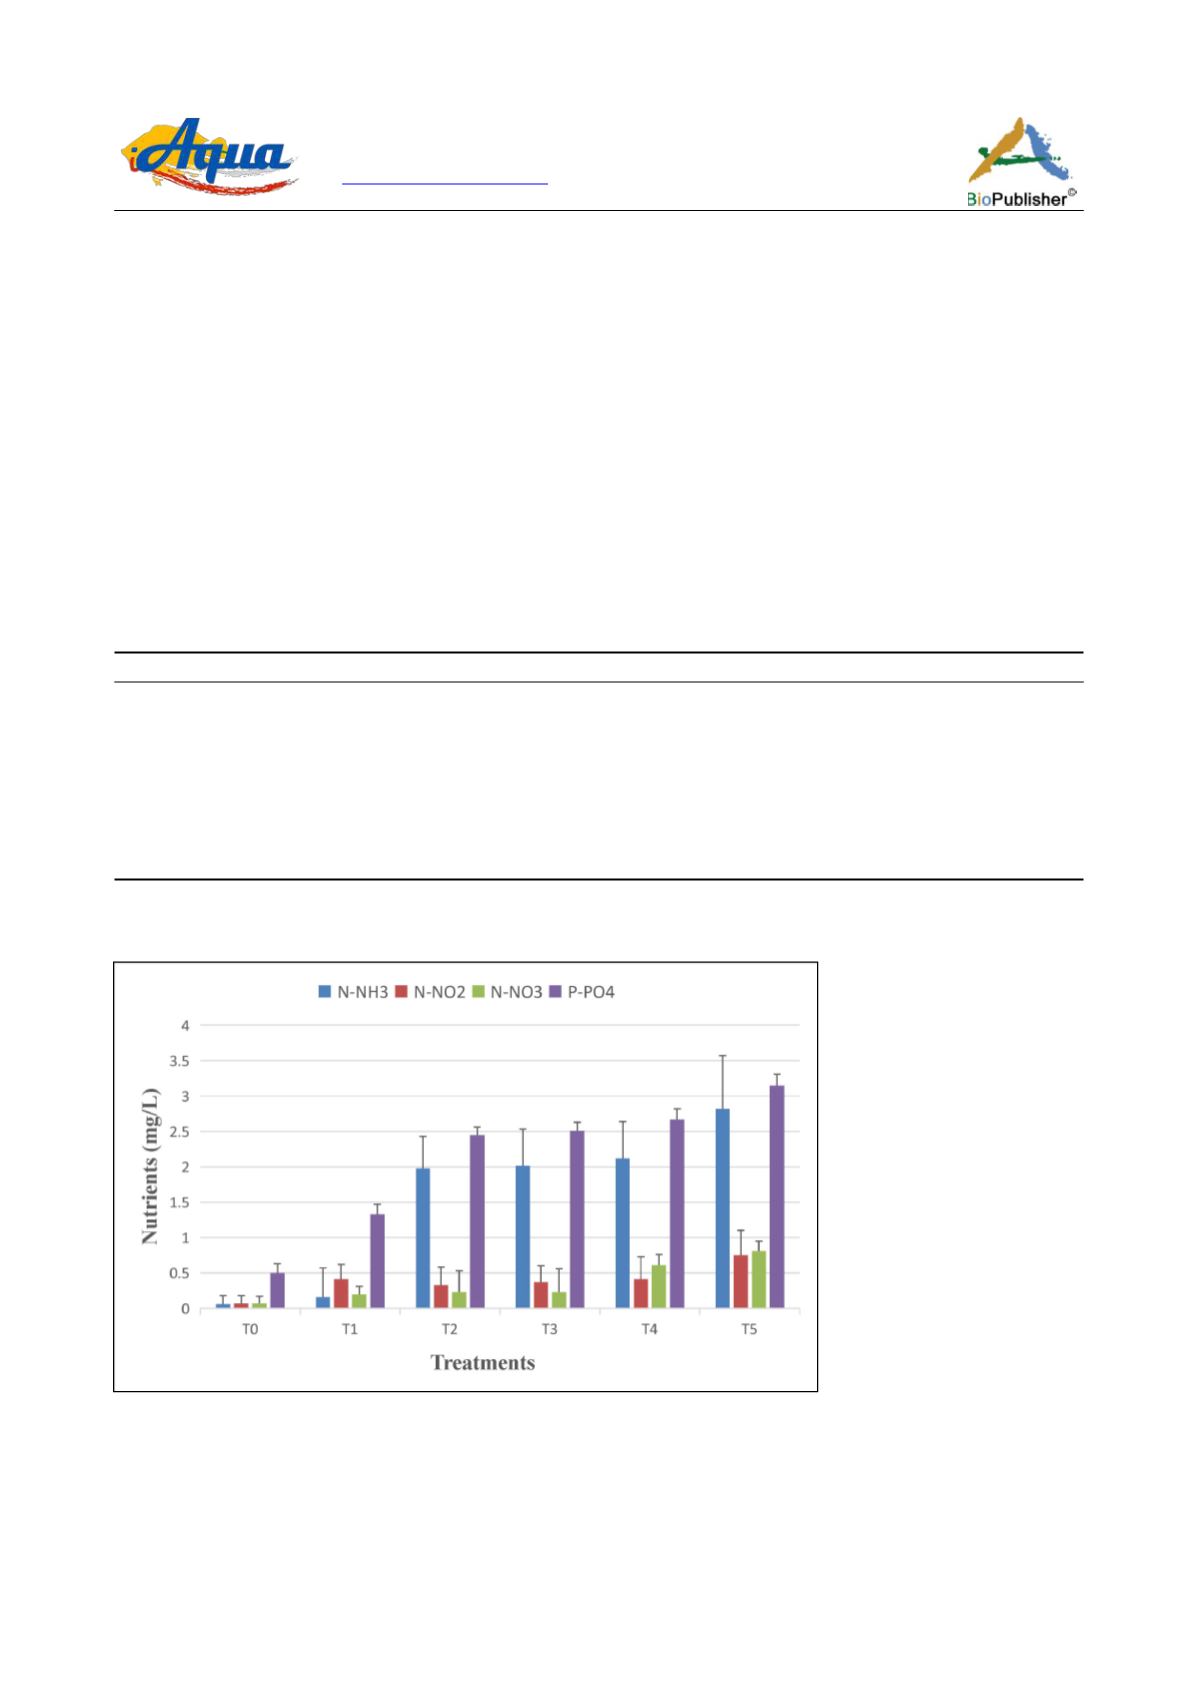
clearly its low proportion in suspended matter and algae. Concentrations of N-NH3 obtained were important in all
treatments except T
0
and varied between 0.06 ± 0.12 mg/L (T
0
) and 2.82 ± 0.75 mg/L (T
5
) (Figure 3). Concerning
mean values of nitrite and nitrate, they varied respectively between 0.07 ± 0.11 mg/L and 0.08 ± 0.1 mg/L for T
0
;
0.75 ± 0.35 mg/L and 0.81 ± 0.14 mg/L for T
5
(Figure 3). By the same way, orthophosphate concentration is high
in all treatments except in T
0
and followed the same trend with a mean value in range of 0.5 ± 0.13 mg/L (T
0
) and
3.15 ± 0.16 mg/L (T
5
) (Figure 3). These different concentrations of in the different treatments were highly
significant (F
(15, 36)
= 842.99; p<0.00). It results from this analysis that the organic fertilizer (rabbit manure) used
had strongly affected the water quality of different culture areas in plurispecific production of fresh water
zooplankton. Thus, it could be used as a fertilizer for primary production.
Table 1 Physico-chemical parameters of different treatments
Parameters
T
0
T
1
T
2
T
3
T
4
T
5
T°C
33.74±1.70a 34.02±1.81a
34.30±1.70a
34.34±1.87a
34.48±1.86a
34.51±1.78a
Cond (µs/cm)
37.66±23.17e 597.82±34.10b 604.50±23.17b 607.19±22.12b 625.58±36.08ab 664.45±50.63a
pH
6.87±0.94b 7.29±0.79a
7.33±0.94a
7.12±0.92a
7.09±1.05a
7.16±1.05a
DO (mg/L)
3.81±0.72f
7.48±1.95e
9.22±0.72bc
8.45±2.40bc
8.82±2.95ab
9.42±3.33a
Sal (mg/L)
0.08±0.01e
0.31±0.02b
0.32±0.01b
0.32±0.01b
0.33±0.01ab
0.36±0.03a
TDS
64.60±8.77e 296.92±17.07b 302.56±8.77b 303.43±7.47b 318.76±16.81ab 338.61±27.11a
Transp (cm)
27.91±0.37a 22.50±1.13b
16.85±1.51c
17.63±1.41d
14.43±1.38e
12.98±1.50f
Note: Cond = conductivity, DO = dissolved oxygen, Sal = salinity, Transp = transparency, TDS = total dissolved solids. Mean values
affected by the same letter on the same line are not significantly different at the threshold of 5% according to LSD of Fisher
Figure 3 Nutrients proportion in different culture middle
3.2 Trophic parameter
Figure 4 expresses different concentrations of chlorophyll-a obtained during experiment in each treatment. There
was a high significant difference among treatments (F
(40, 96)
= 1003.5; p<0.00). Also, we observed a strong linear
correlation between the increase of chlorophyll-a rate and different doses of rabbit manure (R = 0.88; R² = 0.78;


