Computational Molecular Biology, 2018, Vol.8, No.1, 1-13
5
al., 2014b; Zhu et al., 2018). Thus, more cotton genes undergoing AS are expected to be identified when more
gene expression data are available.
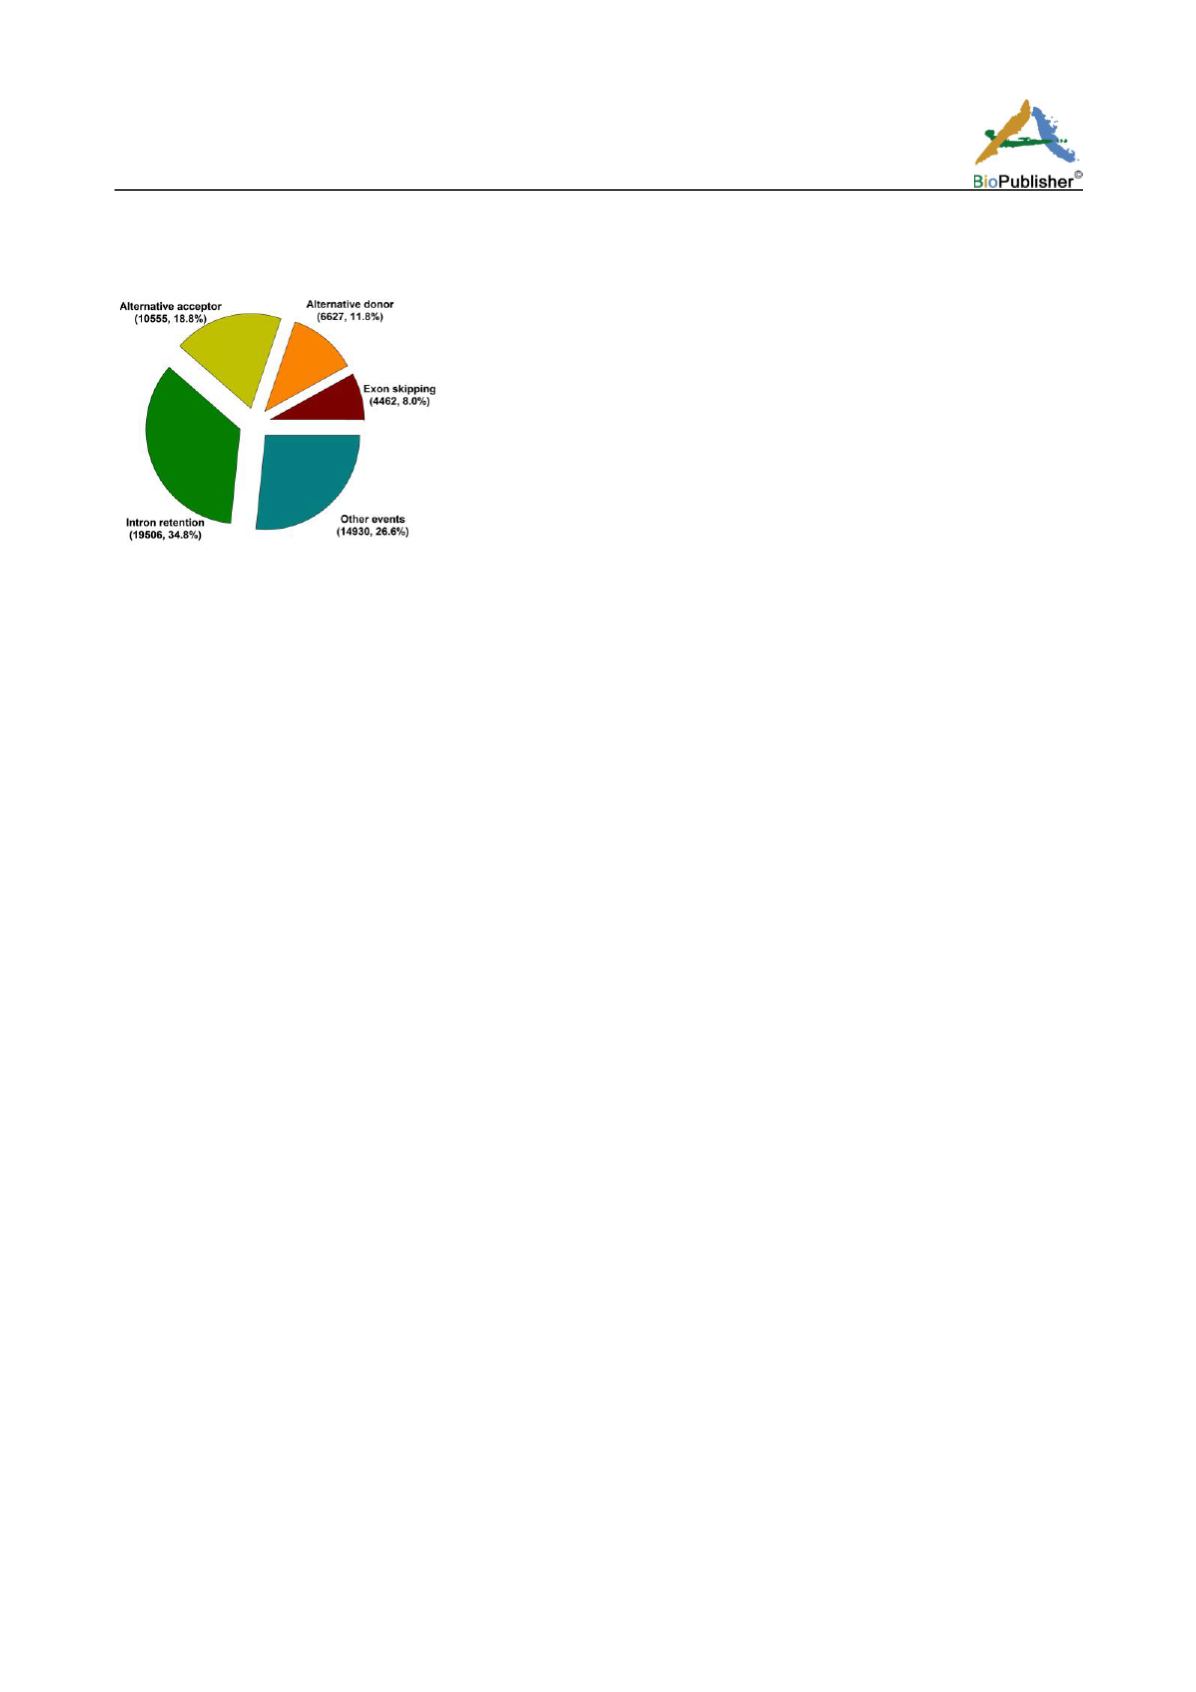
Figure 1 Landscape of alternative splicing events in cotton
Among the AS events, IR (34.8%) was the prevalent type, followed by AltA (18.8%) and AltD (11.8%), with ES
(8.0%) as the least type of AS events (Figure 1). Though there were some variations in distributions of AS types,
this pattern of AS events was consistent in all cotton species (Li et al., 2014; Zhu et al., 2018) as well as in other
plant species so far we have investigated as well as plant species examined by others including Arabidopsis,
Brachypodium distachyon
, cereal plants, and fruit plants (Wang and Brendel, 2006; Baek et al., 2008; Labadorf et
al., 2010; Sablok et al., 2012; VanBuren et al., 2013; Walter et al., 2013; Thatcher et al., 2014; Min et al., 2015;
Sablok et al., 2017). We also observed that the proportion of complex events varied in different plant species or
different analysis of the same species, and the ratio was positively correlated with the average length of assembled
transcripts (Min et al., 2015; Min, 2017; Sablok et al., 2017).
One interesting finding of the role of transposons played during AS in plant species was reported recently by Li et
al. (2014). Transposable elements (TEs) were found in only 2.9% of all introns, however, 43% of the retained
introns were found to have TEs in the AS transcript isoforms. Such an enrichment of TEs in the retained introns in
the AS isoforms suggested TE-insertion may play an important role during AS (Li et al., 2014b). In our datasets
we retrieved 12,774 retained introns with a length > 30 bp and found only 263 TEs, about 2.1% having TEs in
retained introns. Such a discrepancy of TEs in the retained introns of AS isoforms might be resulted by the data
processing procedure because in our data cleaning steps, for avoiding misassembling, we purposely removed plant
repetitive DNA elements including TEs from the ESTs and mRNA sequences prior to assembling PUTs.
It should be noted that the mapping of PUTs in this work used a cutoff of 95% sequence identity for the aligned
regions, this cutoff value could not distinguish homoeologous genes between two subgenomes or homologous
genes from recent gene duplications. Full-length mRNA sequences including both 5’-and 3’ untranslated regions
(UTRs) with strict sequence identity, i.e., 100%, should be able to distinguish transcript isoforms of AS generated
from two subgenomes. Recent work using single molecule long-read isoform sequencing (Iso-Seq) identified
full-length transcript isoforms and was able to distinguish isoforms from two subgenomes in
G. barbadense
, an
allotetraploid cotton species (Wang et al., 2018). It was estimated that ~51.4% of homoeologous genes produced
divergent isoforms in each subgenome (Wang et al., 2018).
2.4 Functional classification of PUTs and AS genes
All PUTs including both mapped and unmapped PUTs were annotated functionally as described in section 3.1. To
simplify description, predicted gene models having AS transcript isoforms are referred as AS genes, and gene
models not having AS transcripts in the current analysis are referred as non-AS genes. To obtain a general picture
of protein family distribution in AS genes and non-AS genes, the predicted protein sequences of the PUTs were
used to search the Pfam database. For genomic loci having more than one isoform PUT, only one Pfam annotation
was selected from each genomic locus. A total of 57,900 Pfam matches from a total of 3,505 protein families were
obtained from encoded proteins of a total of 88,420 loci. Among 23,930 genomic loci having AS isoforms, 18,218


