International Journal of Marine Science 2015, Vol.5, No.16, 1-12
5
high is possibly due to intrusion of upwelling seawater,
which increased the level of phosphate (Nair et al.,
1984). Further, regeneration and release of total
phosphorus from bottom mud into the water column
by turbulence and mixing also contributed to the
higher values during monsoon (Chandran and
Ramamoorthy, 1984).
The silicate values ranged between 11.35 and 20.47
µmol l
-1
(Figure 3)
.
The silicate content was higher
than that of the other nutrients and the recorded high
monsoon values could be due to large influx of
freshwater derived from land drainage carrying
silicate leached out from rocks and also from the
bottom sediment (Rajasegar, 2003). The observed low
summer values could be attributed to uptake of silicates
by phytoplankton for their biological activity (Ashok
Prabu et al., 2008; Saravanakumar et al., 2008).
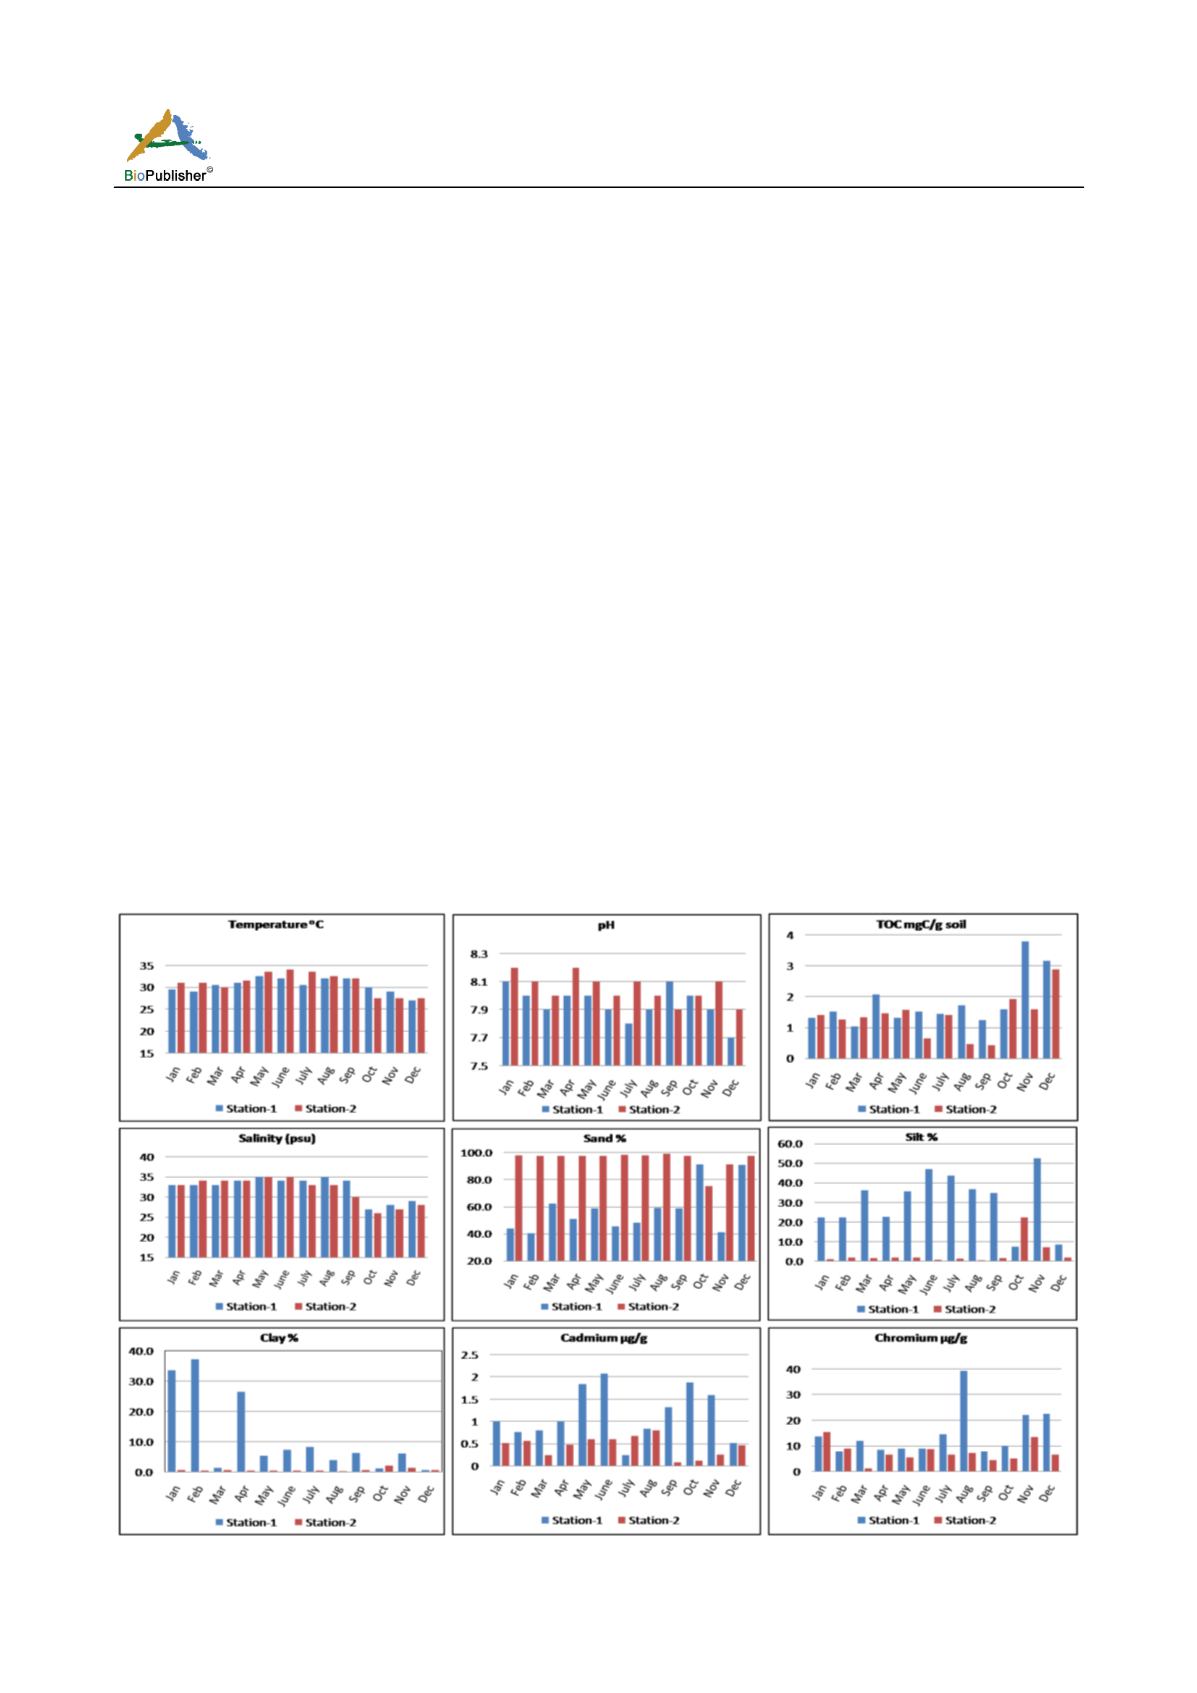
The sediment temperature was ranged between 27
o
C
and 34
o
C (Figure 4). The maximum sediment
temperature value was recorded at station 2 and the
minimum was recorded in station 2. All stations
showed a similar trend with similar seasonal
variations. The physico-chemical factors of sediments
is a key on quality assessment of sediments in costal
environment, in this concern the present study
analyzed the physic-chemical characterization of
sediments in three different stations of costal. Oceans
large thermal inertia causes temperature variation due
to absorption of solar energy and subsequent release to
the atmosphere (Varadhachari et al., 1987). Similar
trend recorded due to freshwater flow (Varadhachari et
al., 1987). The sediment salinity was ranged between
26 psu and 35 psu (Figure 4). The maximum and the
minimum values were recorded in station 2. The
sediment pH was ranged between 7.7 and 8.2 (Figure
4). The maximum recorded in station 2 and the
minimum was recorded in station 1. These physical
parameters of the sediment characteristics were
maximum value during summer and the minimum
during monsoon. Total organic carbon of the sediment
was ranged between 0.435 and 3.795 mgC/g soil
(Figure 4). The minimum TOC recorded during
pre-monsoon period at station 2 and the maximum was
recorded during monsoon at station 1. The distribution
of total organic carbon closely followed the distribution
of sediment fine nature and clay content and high rate
sedimentation (Raghunath and Sreedhara Murthy, 1996).
Figure 4 Sediment parameters Temperature, pH, TOC, Salinity Sand %,Silt%, Clay%, Cadmium and Chromium present in the study period


