International Journal of Marine Science 2015, Vol.5, No.16, 1-12
2
depending on the direction of the wind (Varkey et al
.
,
1996; Madhupratap et al
.
, 2003). The objective of this
research was to characterise benthic communities
(based on species abundance data) and link them to a
suite of environmental factors (e.g. surface seawater
temperature, salinity, dissolved oxygen and
heavy-metal) measured synchronously at two
predetermined locations in the inshore waters of the
Bay of Bengal.
1 Materials and Methods
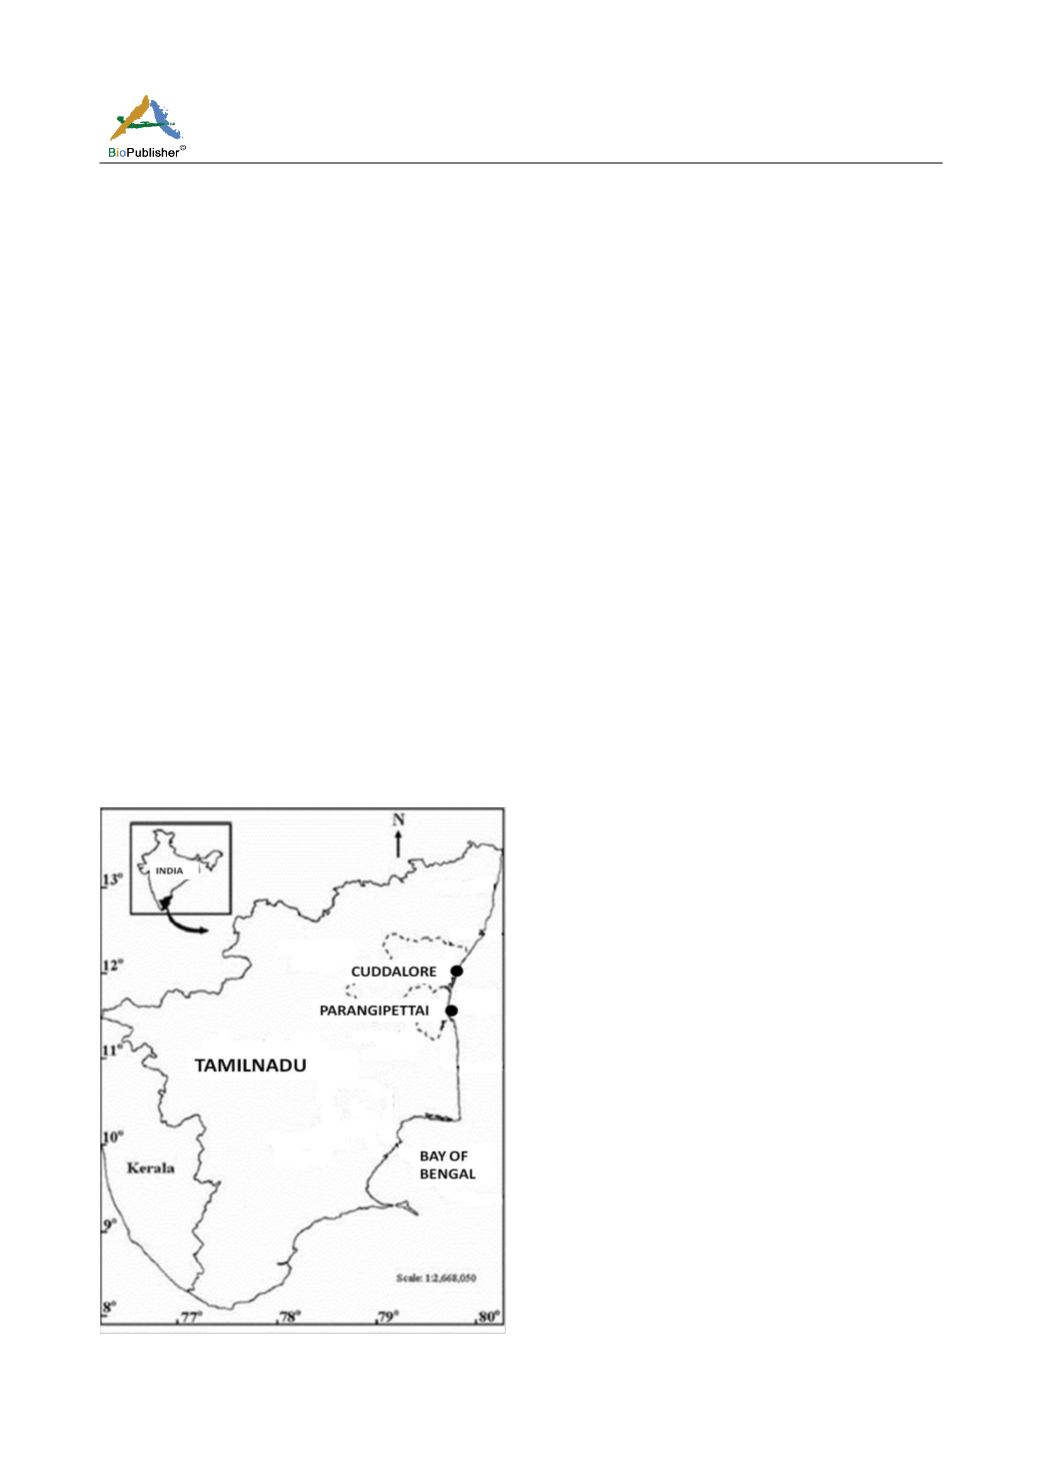
Four seasonal collections were made (January 2013 to
December 2013), and altogether, 24 samples were
taken from 2 stations (duplicate samples were
collected from each station—4 seasons ×2 stations ×2)
belonging to two transects, namely Cuddalore (Station 1)
(11
o
42’ N and 79
o
47’ E) besides a station near State
Industrial Promotion Council of Tamilnadu (SIPCOT)
industrial cluster and Parangipettai (Station 2)
(Lat.11
29’N and 79
46’E) – (Figure 1). Grab hauls
were obtained according to standard protocols of
Holme and McIntyre (1984). The environmental
parameters such as temperature, salinity, dissolved
oxygen and pH were analysed following the methods
of (Stickland and Parsons, 1972).
Figure 1 The map showing the study area
Van veen grab (0.1 m
2
) was used for unit sampling
and the subtidal benthic samples were collected
monthly from each station. Hand operated grab hauls
used for collect the sediment samples for
physic-chemical and biological parameters. Collected
sediment samples were transferred into pre-labeled
polythene bags for subsequent determination of the
sediment particle sizes. The remaining benthic
samples were washed through a sieve of 0.5mm x
0.5mm mesh size to collect the benthos. The washed
sediment with macrobenthos were poured into a wide
mouth labeled plastic container and preserved with
10% formaldehyde solution to which Rose Bengal
(dye) had been added. The Rose Bengal dye at
strength of 0.5% selectivity colored all the living
organisms in the sample (Claudiu et al.,
1979; Zabbey,
2002; Idowu and Ugwumba, 2005). The preserved
samples were later taken to the laboratory for further
analysis.
All taxa were first segregated into different groups and
then identified to specific, generic or other higher
levels to the greatest extent possible with the help of
standard taxonomic references. Fauvel, 1953 and Day,
(1967) for Polychaeta, for Mollusca: Subba Rao et al.,
(1991). The organisms were counted under a
stereoscopic microscope (Motic
B3 series
, and
40×magnification) and abundance was expressed as
individuals per square meter. Sediment samples were
subjected to pipette analysis according to the standard
method (Krumbein and Pettijohn, 1938).
The data were analysed by various statistical methods
namely univariate measures such as Margalef’s
species richness
(d)
, Shannon–Wiener diversity (
H
’
log2) and Pielou’s evenness (
J
’); graphical tools like
k
-dominance curve and Ellipse plots and multivariate
tools such as Bray–Curtis similarity after suitable
transformation
of
sample
abundance
data.
Classification (hierarchical agglomerative clustering
using group-average linking) and ordination
[multidimensional scaling (MDS)] were used for
treating the data with help of PRIMER 6.1.
2 Result and Discussion
The environmental physical characteristics recorded at
all the stations, the atmospheric temperature varied
from 28
o
C to 34.5
o
C (Fig. 2). The minimum value
was recorded in station 2 during the monsoon season


