International Journal of Marine Science 2015, Vol.5, No.16, 1-12
9
The species count was at the maximum (75) in station
2 during postmonsoon and minimum (58) in station 1
during monsoon. The maximum number of organisms
was 119 animals/0.1 m
2
(station 2, postmonsoon)
(Table 2), and the minimum was 74 animals/0.1 m
2
(station 1, premonsoon). It was apparently low due to
the effect of heavy rainfall. Similar to this (Seshappa,
1953) reported a ‘severe decline’ in the shallow water
macro-benthos during the southwest monsoon, and the
decrease was attributed to lower salinity. The present
observation coincides with the previous findings of
Kumar and Antony, 1994; and Kumar, 2001. The
Shannon–Wiener diversity H’ (Table 2) ranged
between 4.030 (station 1, monsoon) and 4.304 (station
2, postmonsoon). Species diversity is a simple and
useful measure of a biological system. Sanders,
(1968) and Redding and Cory, (1975) found a high
level of agreement between species diversity and the
nature of the environment and, hence, regarded the
measure of species diversity as an ecologically
powerful tool. Moreover, Pearson and Rosenberg,
(1978) proposed that the use of diversity indices is
advantageous for the description of faunas at
different stages in the succession. Sanders, (1968)
postulated that the species diversity is mainly
controlled by the fluctuations in the environment that
lead to less diversity. The pattern of lower species
diversity during monsoon and higher diversity values
in post-monsoon recorded in the study area is in
conformity with the earlier observations made in
Parangipettai and Pazhayar (Chandran, 1987; Devi,
1994). The evenness component (
J
’) (Table 2) varied
from 0.9924 (station 1, monsoon) to 0.9969 (station 2,
postmonsoon). In the case of
H
’ there was no great
difference between stations. However, season-wise
(Table 2), it showed differences. It was low during
the monsoon season and gradually increased during
the post-monsoon and summer seasons. The
evenness component (
J
’) (Table 2) showed a gradual
decrease with the increase of stations, and
season-wise (Table 2), it was lower during monsoon
and higher during summer seasons. The species
richness (Margalef’s
d
)
(Table 2) ranged between
12.97 (station 1, monsoon) and 15.48 (station 2,
postmonsoon). Similar observation was reported by
Kumar, (1995) in Cochin waters.
Table 2 Diversity indices in various stations of Cuddalore and Parangipettai
Station
S
N
d
J'
H'(loge)
1-Lambda'
St1-Post-monsoon
64
116
13.26
0.9949
4.138
0.9923
St1-Summer
63
87
13.87
0.9957
4.125
0.9949
St1-Premonsoon
60
74
13.7
0.996
4.078
0.9962
St1-Monsoon
58
81
12.97
0.9924
4.03
0.9939
St2-Postmonsoon
75
119
15.48
0.9969
4.304
0.9947
St2-Summer
61
81
13.64
0.9966
4.097
0.9954
St2-Premonsoon
59
76
13.37
0.9962
4.062
0.9955
St2-Monsoon
67
90
14.65
0.9957
4.186
0.9955
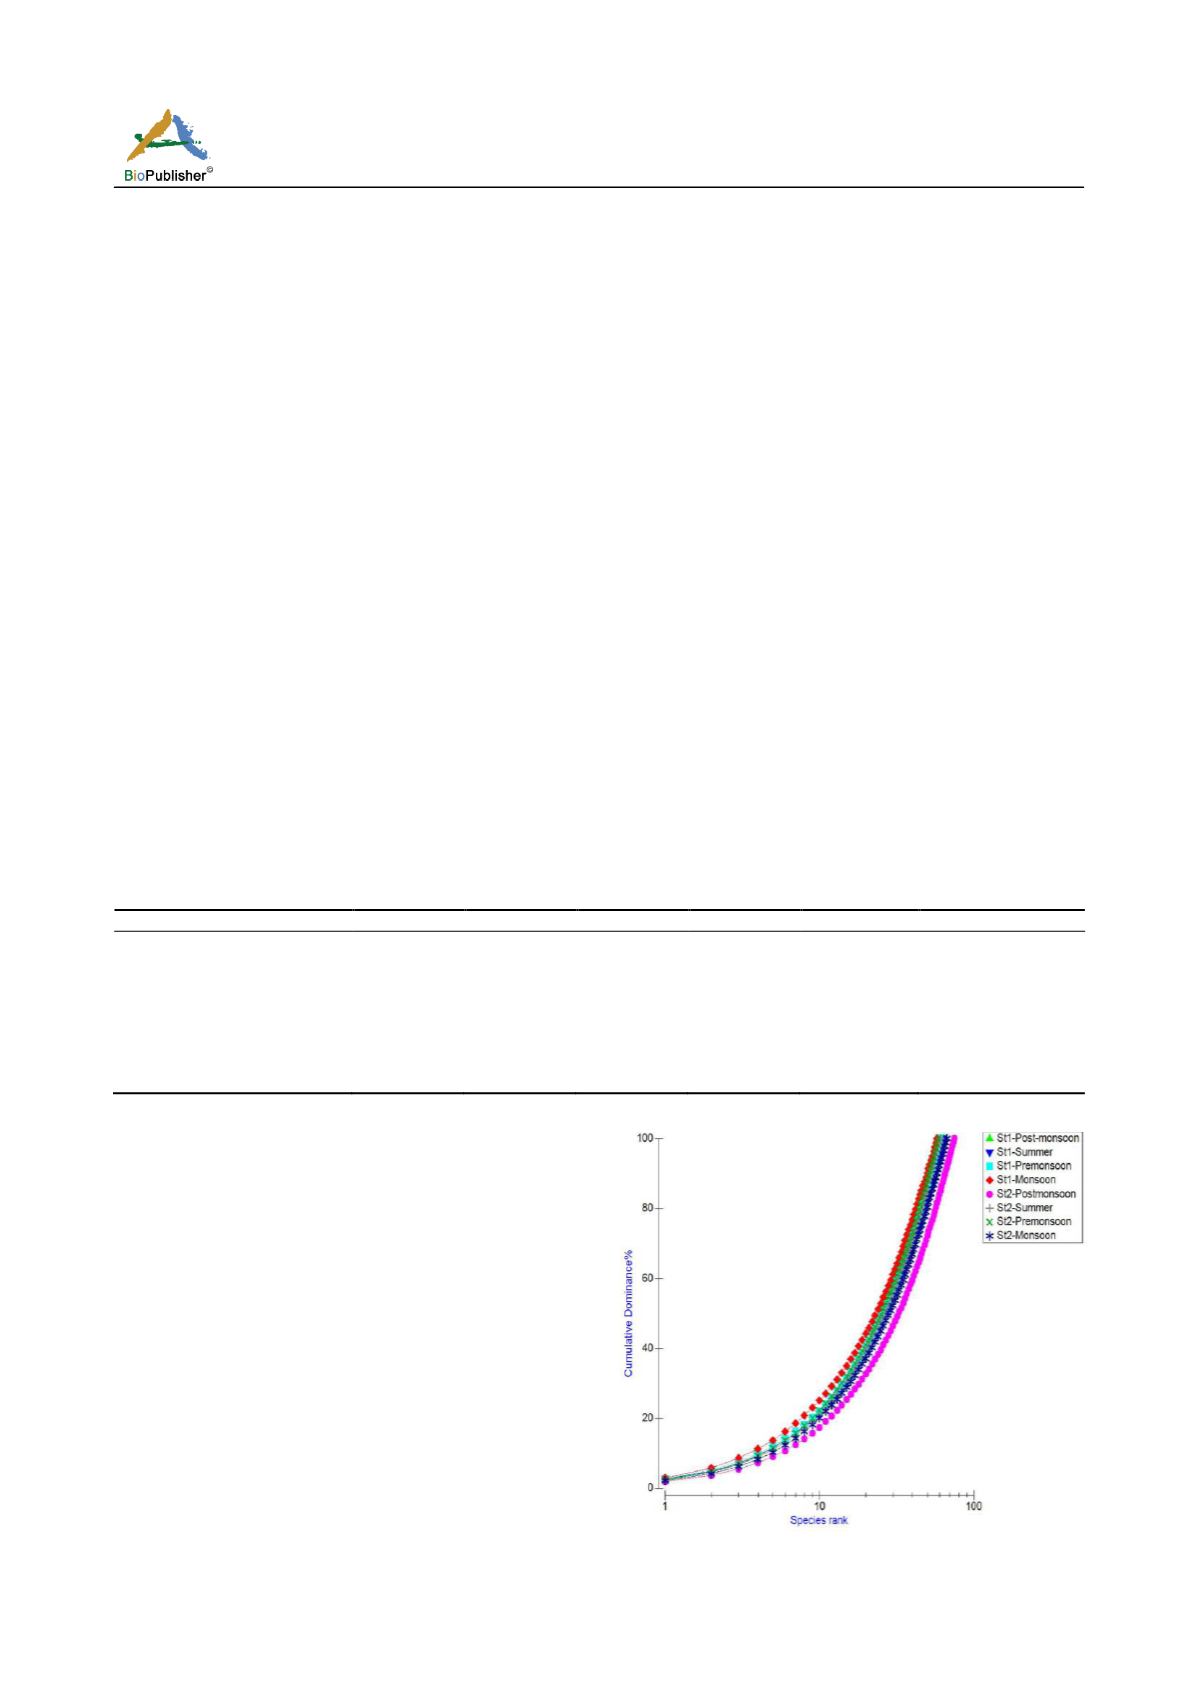
Multiple
K-
dominance plot facilitated the
discrimination of benthos according to species- relative
contribution to Standard stock. When all the stations
belonging to all the seasons were plotted together, the
curve for station 2 (postmonsoon) was lying low and
was ‘
∫’
shaped, indicating highest diversity, whereas
the curve for station 1 (monsoon) was lying high,
showing lowest diversity (Figure 6). When the
k
-
dominance plot was also plotted for the season, and
the curve for the summer season was lying low,
indicating highest diversity, whereas the curve for the
pre-monsoon season, which showed the lowest
diversity, was lying high (Figure 6). The
k-
dominance
plat for station 2 during all the seasons shows the
highest diversity in station 2 during the postmonsoon
and the lowest during the monsoon seasons.
Figure 6
K
- Dominance plot for all stations and seasons


