International Journal of Marine Science 2015, Vol.5, No.16, 1-12
6
Percentage of sand particles varied from 40.410% to
99.178% (Figure 4). The maximum level of sand
particles was present in station 2 and minimum sized
particles are present in station 1. Percentage of silt
particles varied from 0.459% to 52.441% (Figure 4).
The maximum level of silt particles was present in
station 1 and minimum sized particles are present in
station 2. Percentage of clay particles varied from
0.363% to 37.312% (Figure 4). The maximum level of
silt particles was present in station 1 and minimum
sized particles are present in station 2. Sand, slit and
clay was supported by following research articles
(Badarudeen et al., 1996; Chanda et al.,
1996).
The concentration heavy metal found to be due to the
meager metal rich fresh water influx. The sediment
heavy metal values were recorded as follow as. The
cadmium levels were ranged between 0.08 µg/g and
2.08 µg/g (Figure 4). The maximum value was found
in station 2 during pre-monsoon and the minimum
was recorded in station 1 during summer. The
chromium levels were ranged between 1.12 µg/g and
39.32 µg/g (Figure 4). The maximum value was found
in station 1 during pre-monsoon and the minimum
was recorded in station 2 during post monsoon. The
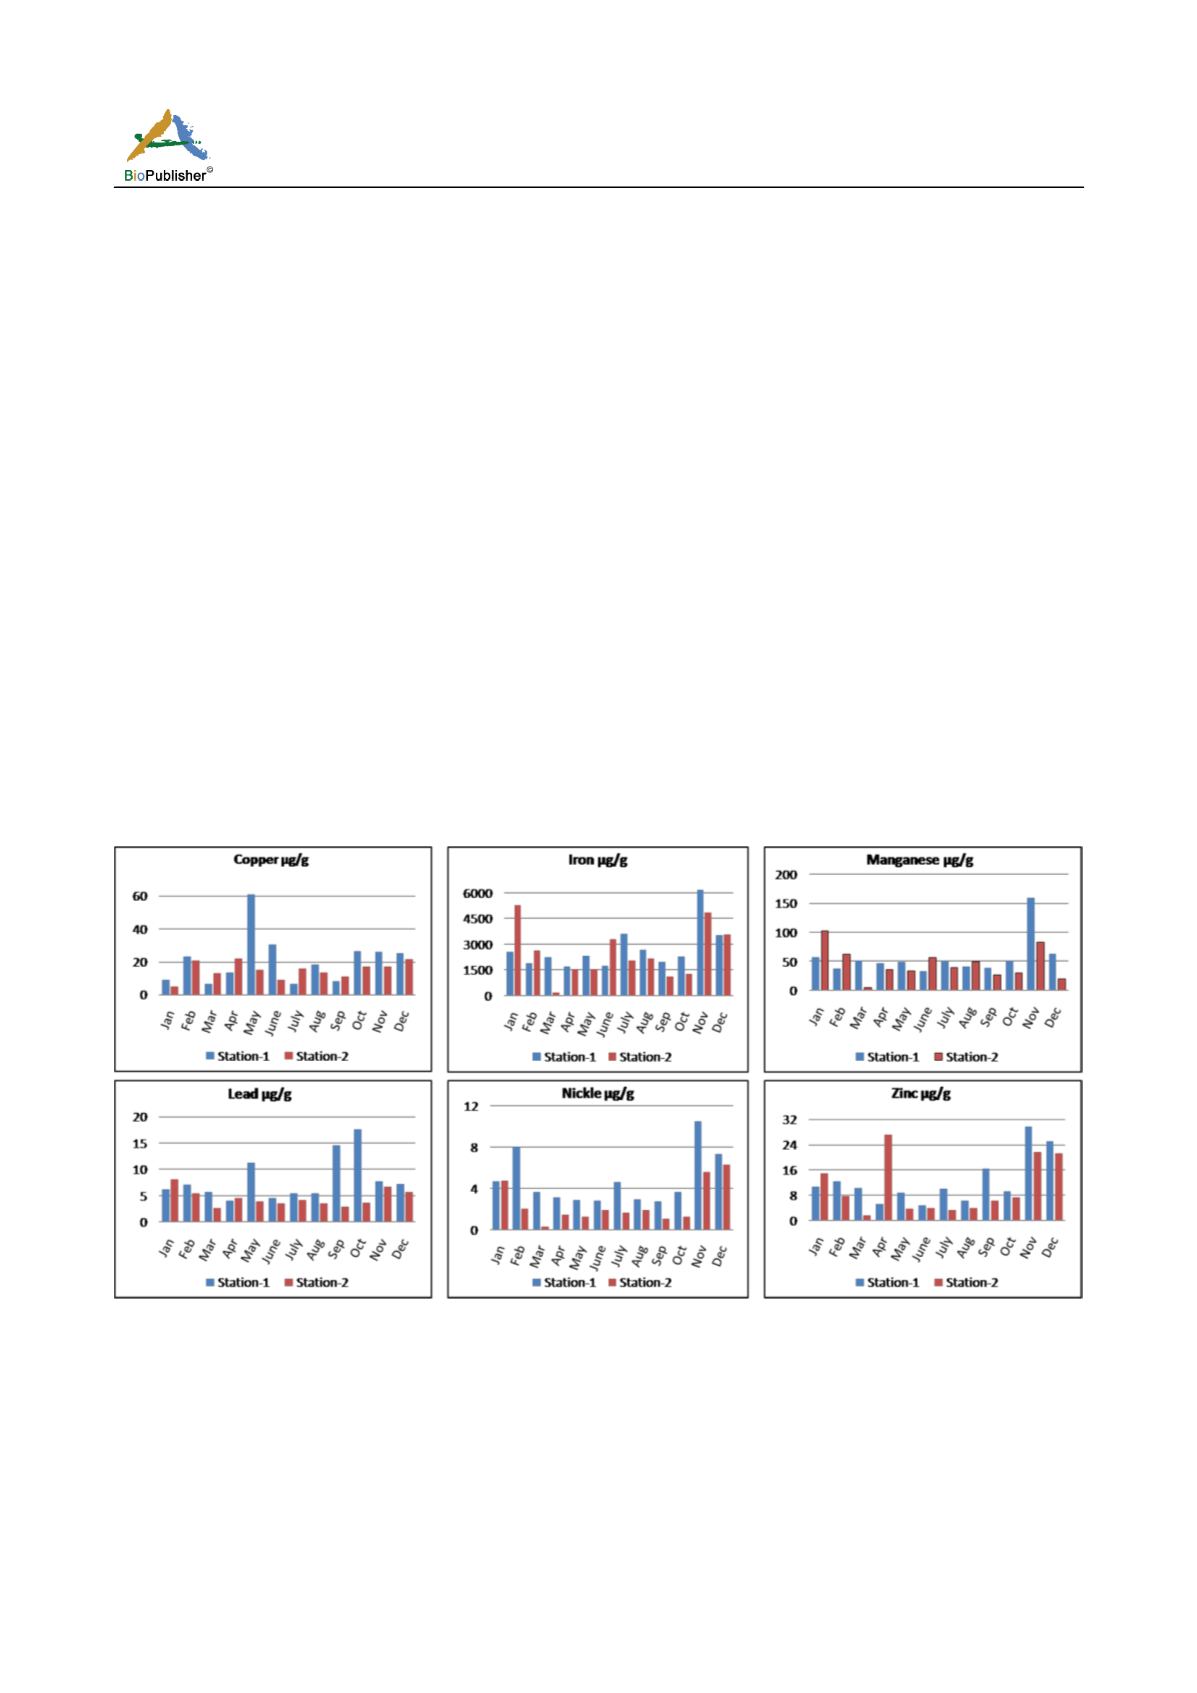
copper levels were ranged between 4.84 µg/g and
60.72 µg/g (Figure 5). The maximum value was found
in station 1 during summer and the minimum was
recorded in station 2 during monsoon. The elements
Cr, Cu and Cd displays quite similar pattern of
distribution, these elements are used as markers of
metal industries (Kumar et al., 2001; Loska et al.,
2004). Which are probably controlled by sedimentary
features such as organic matter and grain size
(Harbison, 1984). The Cr and Cu in the industry and
domestic waste affected areas suggesting that iron
and steel industries and sewages contribute equally
to the contamination in the study area (El Nemr et al.,
2006). Cadmium enrichment is independent of the
accumulation rates of terrigenous detritus input
(Calvert and Pedersen, 1993). These elements are
known as markers of paint industries (Lin et al., 2002)
many are present in the study area.
Figure 5 Sediment parameters Copper, Iron, Manganese, Lead Nickle and Zinc present in the study period
The Iron levels were ranged between 172.16 µg/g and
6200 µg/g (Figure 5). The maximum value was found
in station 1 during monsoon and the minimum was
recorded in station 2 during post monsoon. It seems
likely that the Fe enrichment results in the reduction
of Fe in the sediment during the oxidation of organic
matter (Francois, 1988). The manganese levels were
ranged between 4.12 µg/g and 158.84 µg/g (Figure 5).
The maximum value was found in station 1 during
monsoon and the minimum was recorded in station 2
during post monsoon. The iron and manganese can be
converted to complex hydroxy compounds that may
eventually precipitate (Riley and Chester, 1971). It is
well established that iron and manganese oxides are


