International Journal of Aquaculture, 2016, Vol.6, No.4, 1
-
9
7
Table 3 Pair-wise PhiPT values between six populations of
Badis badis
collected from the Terai region
TR-1
TR-2
TR-3
TR-4
TR-5
TR-6
TR-1
0.000
0.010
0.008
0.005
0.011
0.010
TR-2
0.712
0.000
0.001
0.010
0.008
0.007
TR-3
0.671
0.464
0.000
0.011
0.011
0.001
TR-4
0.679
0.376
0.344
0.000
0.010
0.005
TR-5
0.719
0.453
0.376
0.239
0.000
0.009
TR-6
0.701
0.481
0.338
0.381
0.415
0.000
Note: PhiPT value is shown below diagonal and probability based on 999 permutations is shown above diagonal. The shaded cell
indicates the highest value.
Table 4 Pair-wise PhiPT values between six populations of
Badis badis
collected from the Dooars region
DR-1
DR-2
DR-3
DR-4
DR-5
DR-6
DR-7
DR-1
0.000
0.001
0.001
0.001
0.001
0.001
0.001
DR-2
0.646
0.000
0.473
0.001
0.001
0.001
0.001
DR-3
0.665
0.000
0.000
0.001
0.001
0.001
0.001
DR-4
0.503
0.630
0.650
0.000
0.001
0.001
0.001
DR-5
0.570
0.716
0.739
0.551
0.000
0.001
0.001
DR-6
0.744
0.776
0.801
0.706
0.706
0.000
0.001
DR-7
0.712
0.790
0.810
0.683
0.778
0.784
0.000
Note: PhiPT value is shown below diagonal and probability based on 999 permutations is shown above diagonal. The shaded cell
indicates the highest value.
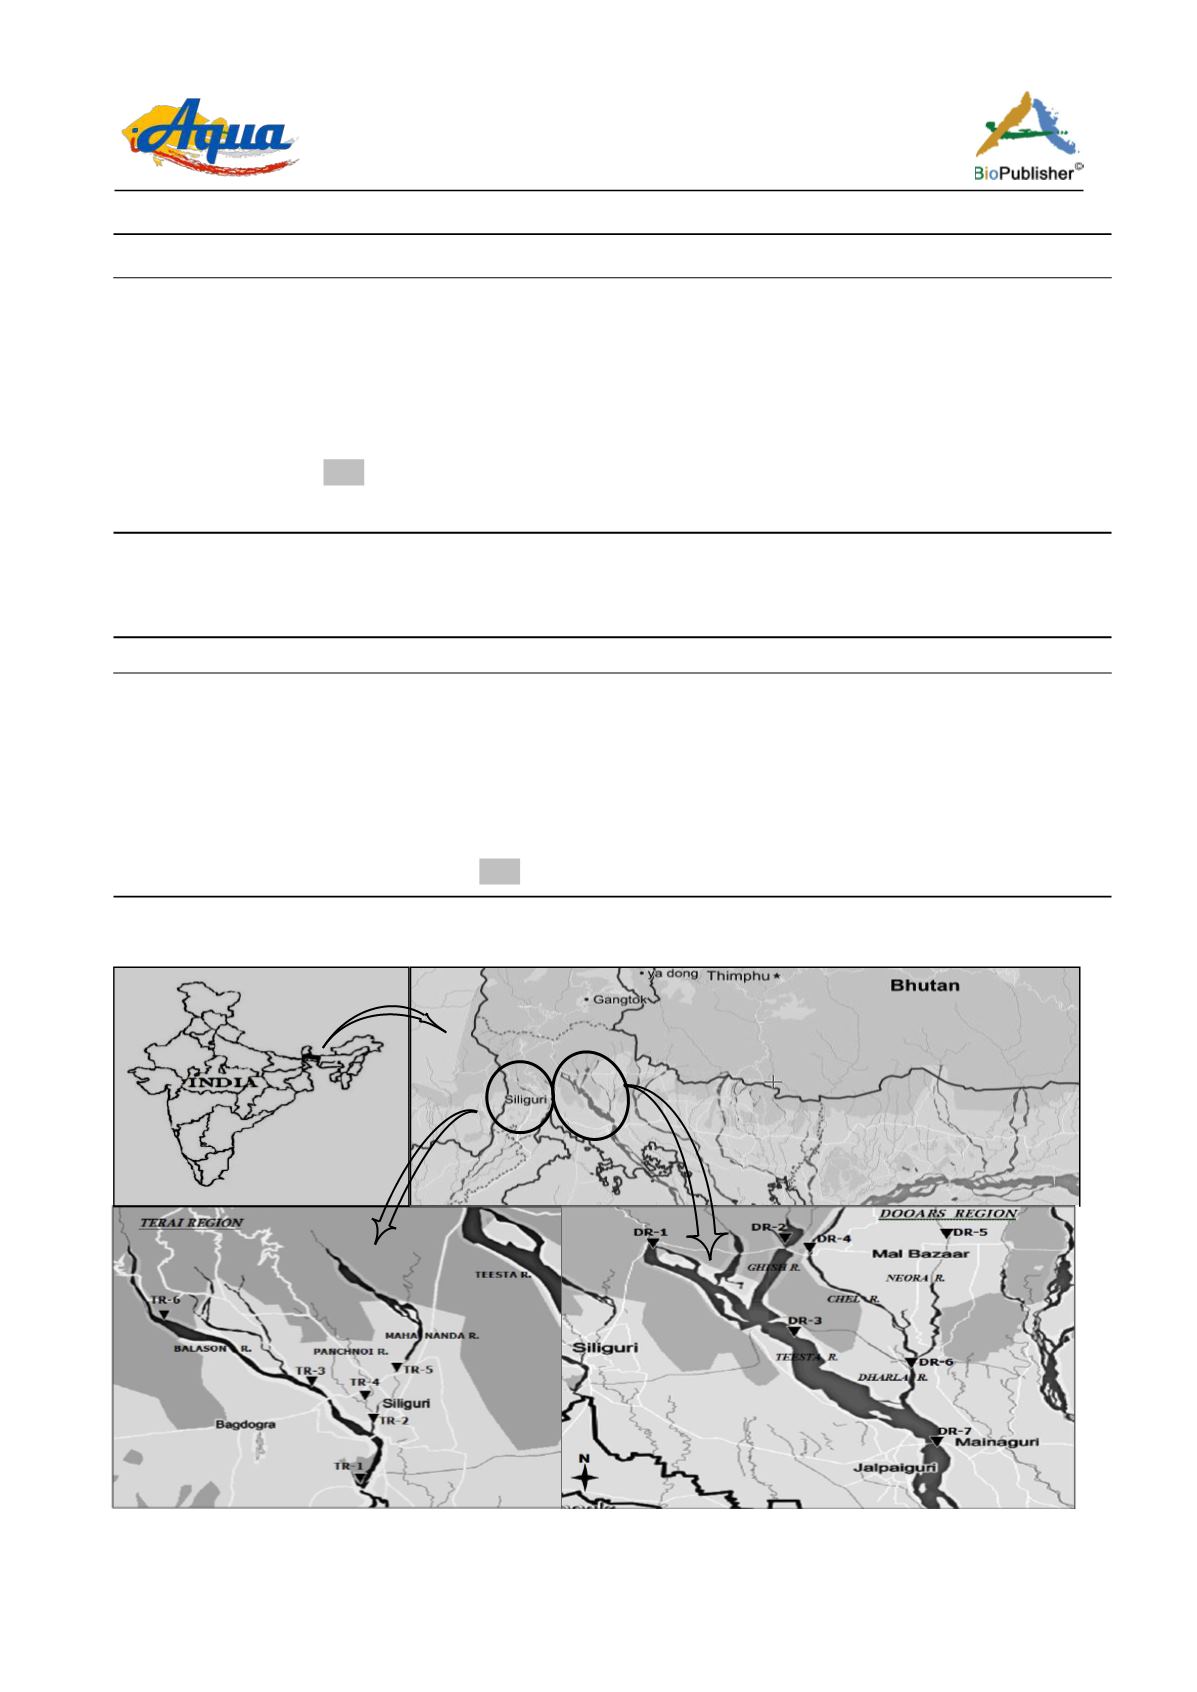
Figure 1 Map showing the collection spots of
Badis badis
from different riverine streams of sub-Himalayan West Bengal, India.
(see text for detail)


