Journal of Mosquito Research 2015, Vol.5, No.11, 1-6
4
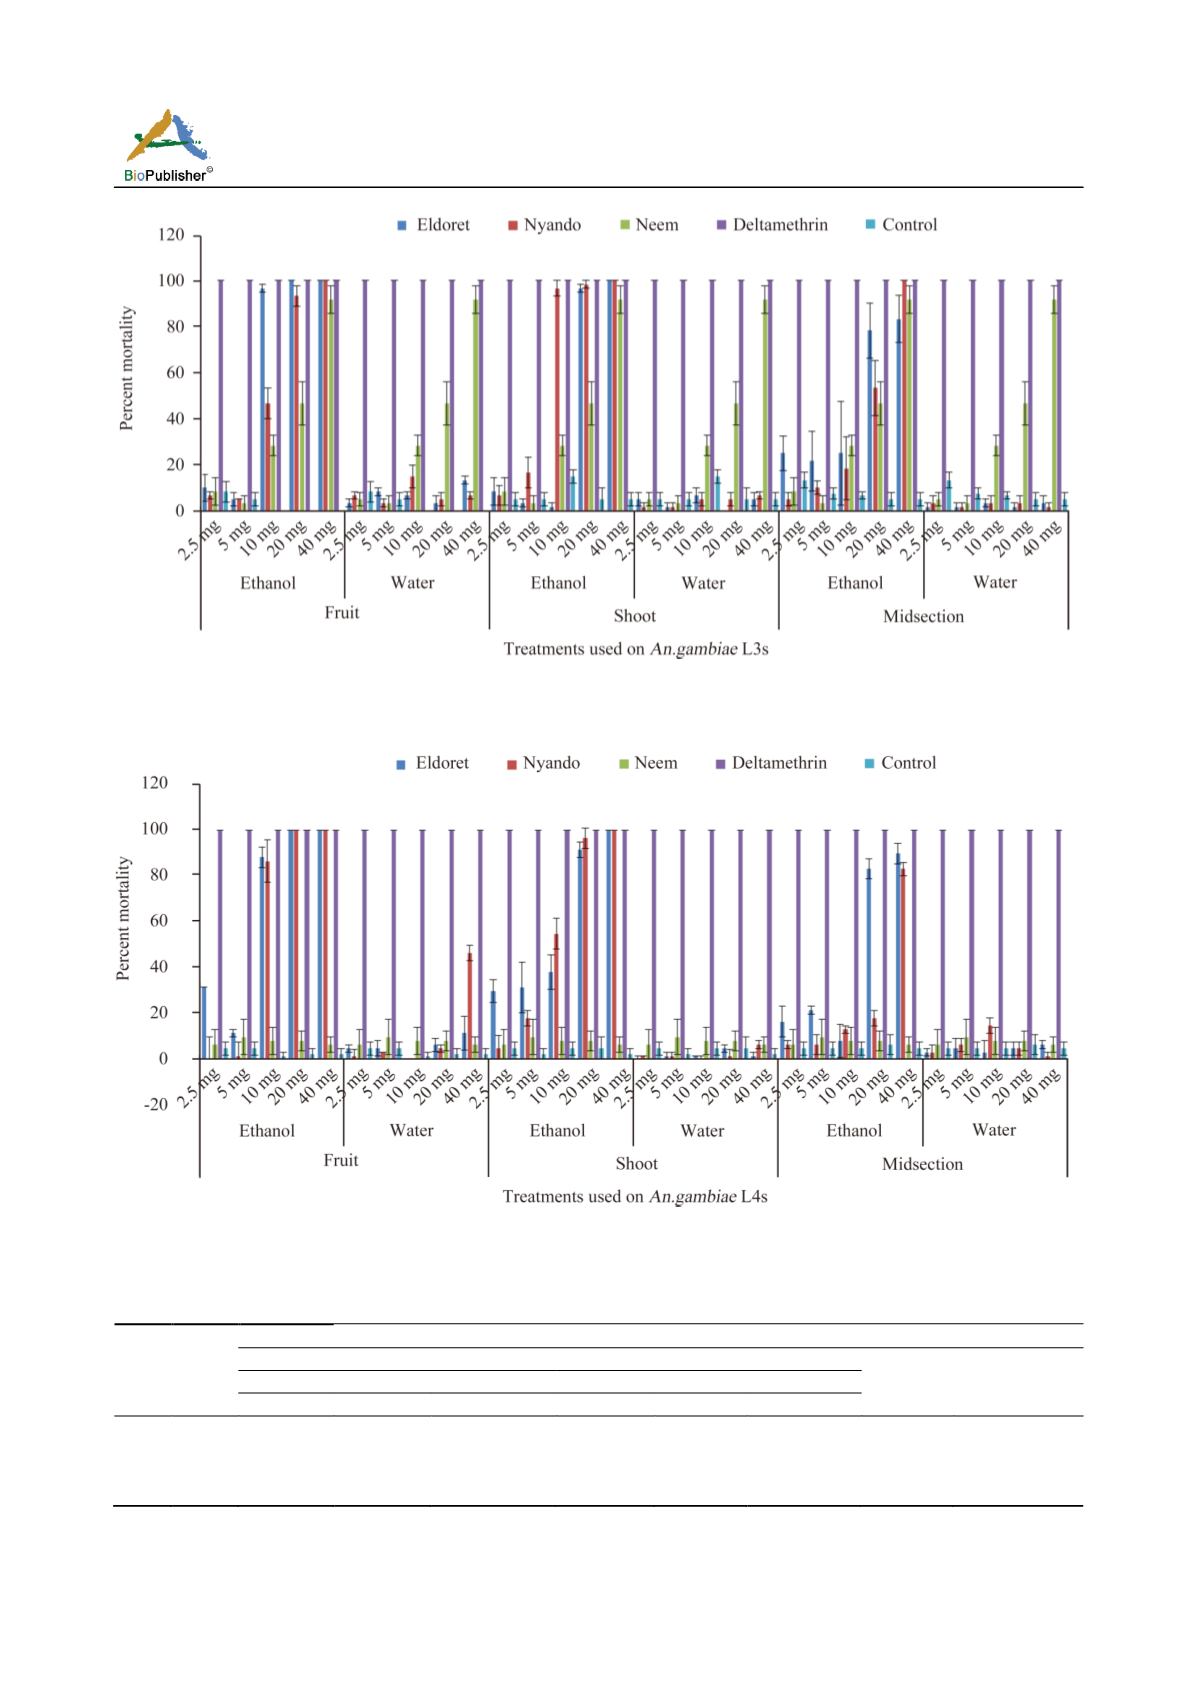
Figure 3 Mortality of
An. gambiae
third instars (L3) exposed to different concentrations of crude ethanol and water Endod extracts.
Error bars represents standard error of means
Figure 4 Mortality of
An. gambiae
fourth instars (L4s) exposed to different concentrations of crude ethanol and water Endod extract.
Error bars represents standard error of means
Table 1 Duncan’s statistics on mortalities due to exposure of
An. gambiae
larvae to crude extracts of parts of Endod
Stage df
Treatments
Parts of Endod used
Neem
Deltamethrin
Eldoret
Nyando
Fruits
Shoot
Midsection
Fruits
Shoot
Midsection
L1
4
0.0128
0.0001
0.0001
0.0145
0.1037
0.3729
0.0001
-
L2
4
0.0449
0.0229
0.0015
0.0660
0.0296
0.0001
0.0008
-
L3
4
0.0603
0.0234
0.2632
0.0399
0.0830
0.0490
0.0001
-
L4
4
0.1679
0.2245
0.0401
0.0037
0.0867
0.0356
0.9642
-
Note: 1 P is the probability for the level of significance. P was considered significant at p < 0.05
2 df is the degree of freedom of the considered units


