International Journal of Marine Science 2015, Vol.5, No.28, 1-8
2
done through Cobb-Douglas production function
analyses. Technical efficiency analysis was done by
Data Envelopment analysis. Willingness To Pay
(WTP) and Willingness To Accept Compensation
(WTAC) was estimated through Contingent
Valuation methodology. Sustainability evaluation
was done through SRL approach (Venkatesh
Salgramma, 2006).
2 Results and Discussion
2.1 Cost of fish production
The cost of fish production is furnished in Table 1.
The variable cost included was fuel cost, cost of
human labour and interest on working capital. It could
be seen from the Table that the total variable cost was
highest for low affected fishermen with Rs. 187250
and it was higher over medium affected fishermen by
102.94 per cent and over serious affected fishermen
by 141.13 per cent. The variable cost of fish
production was highest for low affected category
which was due to the less pollution intensity and the
consequent high fish production in that category.
Among the components of variable cost, fuel cost
accounted for a major proportion and it was 64.02 per
cent for low affected fishermen; 64.01 per cent for
medium affected fishermen; 57.69 per cent for serious
affected fishermen. Cost of human labour formed the
next category and interest on working capital formed
the last category of variable cost.
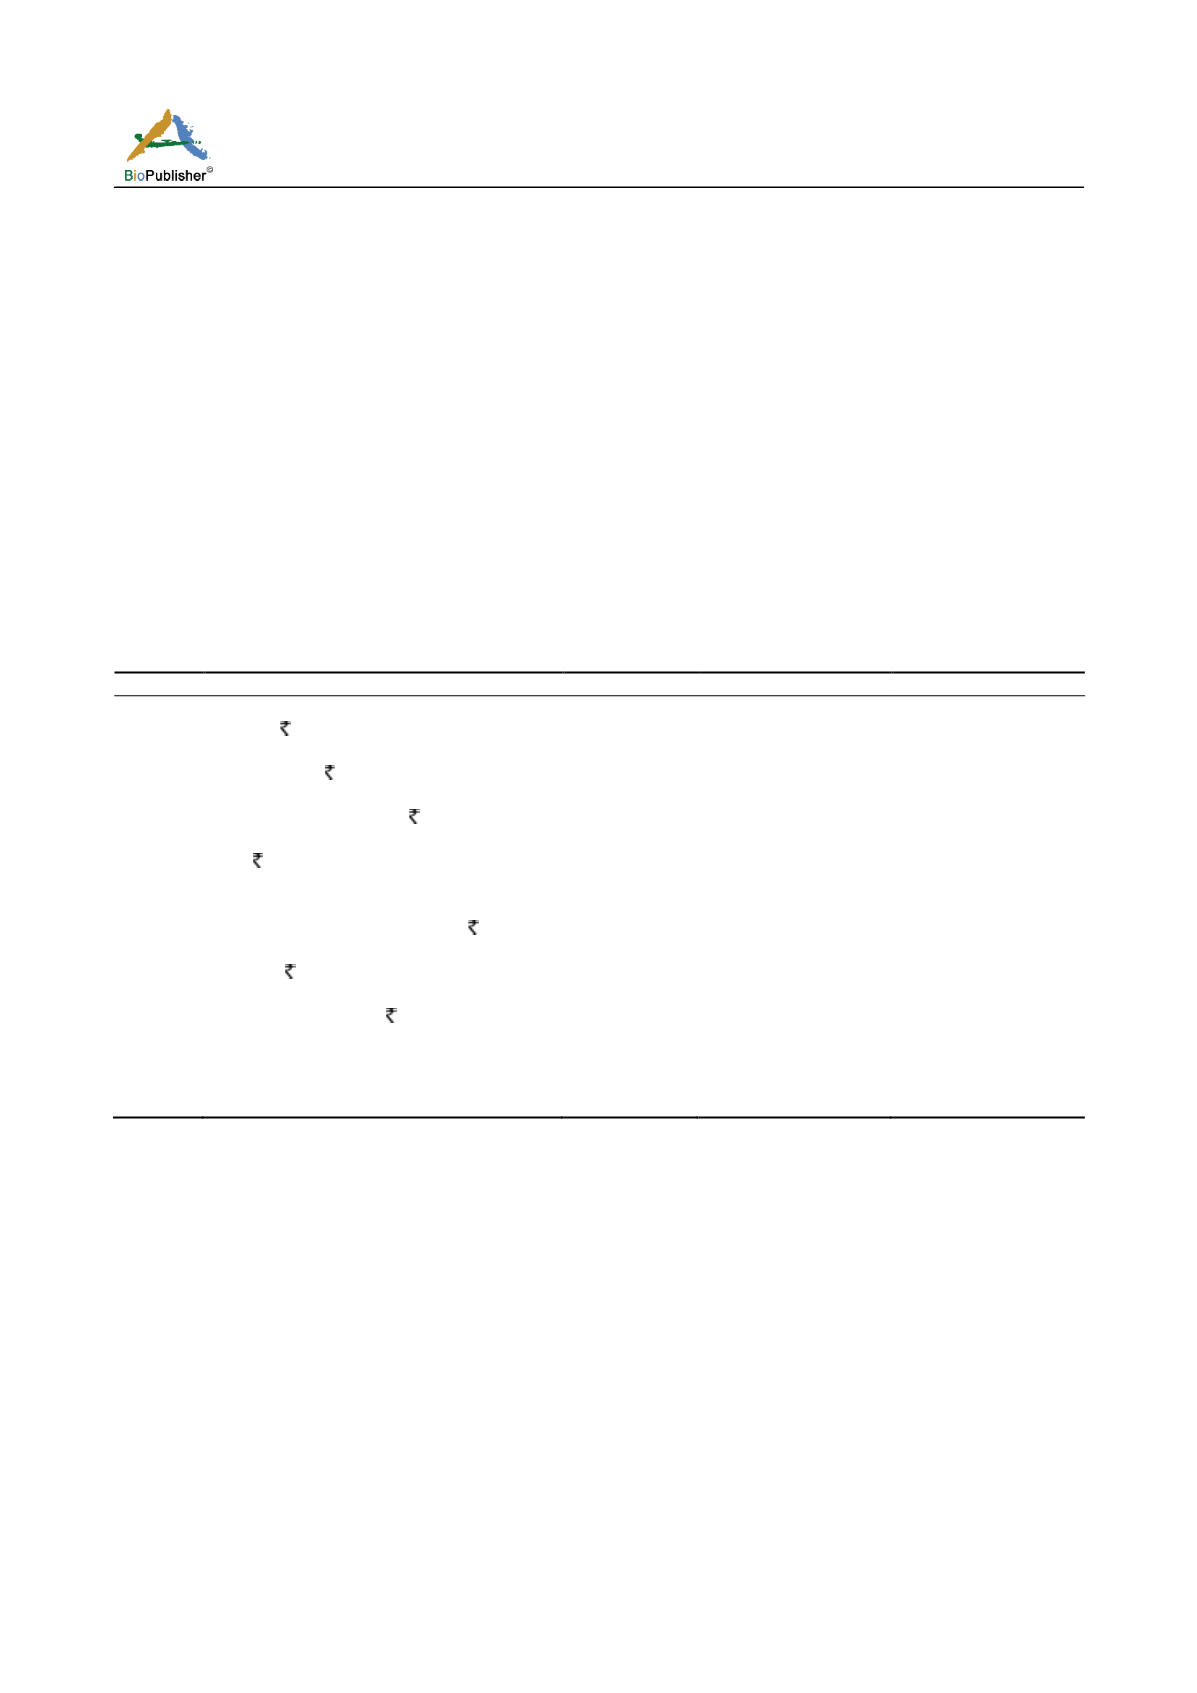
Table 1 Cost of fish production
S. No.
Particulars
Serious
Medium
Low
I.
Variable cost
1
Fuel cost ( )
88000
(57.69)
100000
(64.01)
100000
(64.02)
2
Human Labour ( )
36000
(35.77)
43000
(29.45)
50000
(29.44)
3
Interest on working capital ( )
8680
(6.54)
9450
(6.54)
10080
(6.54)
Total ( )
132680
(100.00)
181900
(100.00)
187250
(100.00)
II.
Fixed cost
1
Depreciation and maintenance cost ( )
13416
(14.88)
14648
(60.88)
36366
(59.52)
2
Insurance ( )
56000
(74.40)
70000
(28.41)
80000
(29.77)
3
Interest on fixed capital ( )
8329
(10.72)
10157
(10.71)
13963
(10.71)
4
Total
77745
(100.00)
94805
(100.00)
130329
(100.00)
III.
Total cost of production
210425
276705
317579
The total fixed cost also was highest for low affected
fishermen with Rs. 130239 and it was higher over
medium affected fishermen by 137.38 per cent and
over serious affected fishermen by 167.52 per cent.
The fixed cost included the depreciation and
maintenance cost, insurance and interest on fixed
capital. The depreciation and maintenance cost was
highest for medium and low affected fishermen and it
was 60.88 per cent and 59.52 per cent respectively to
total of that categories. This cost was highest for
these two categories because fish catch was
relatively higher in them and consequent usage of
boat. Insurance cost was higher in serious affected
category with a proportion of 74.40 per cent because
of the fear of loss in fish production due to the more
presence of negative externalities in that category.
Interest on fixed capital was similar in all categories
and it was around 11 per cent. The total cost was also
higher for low affected category with Rs. 317579 and
it was higher over medium affected category by
114.77 per cent and over serious affected category by
150.92 per cent.
2.2 Gross and Net Income
The detail of gross and net income of sample
fishermen is presented in Table 2. It could be seen
from the Table that the gross income of low affected
category was highest with Rs. 468816 and it was
higher over medium affected category by 142.30 per
cent and over serious affected category by 202.49 per


