International Journal of Marine Science 2015, Vol.5, No.17, 1-4
2
not available, the statistical data used in this study
were from the concerned institution and some various
related publications.
2 Results and Discussion
In 2012, the global eel aquaculture production was a
total of 241,285 Metric tons. The top six countries
(regions) in eel aquaculture production was China,
Japan, Korea, Taiwan, the Netherlands and Denmark,
and the aquaculture production was 212,464 Metric
tons, 17,377 Metric tons, 4,259 Metric tons, 2,244
Metric tons, 1,800 Metric tons and 1,061 Metric tons,
which were accounting for the global the proportion of
eel aquaculture production was 88.06%, 7.20%,
1.77%, 0.93%, 0.75%, 0.44% (Table 1). The sum yield
of the eel aquaculture production of the top six
countries accounted for 99.14% in the global eel
aquaculture production. The first four countries' total
eel aquaculture production accounted for 97.96% in
global eel aquaculture production (Figure 1). Both of
them indicated that a high oligopoly and a high degree
of concentration in global eel aquaculture production
market.
Table 1 Exports of Frozen Fishery Products of Pakistan (2012)
Quantity Metric tons
Countries
Production
percent
China
212464
88.06%
Japan
17377
7.20%
Korea
4259
1.77%
Taiwan
2244
0.93%
Netherlands
1800
0.75%
Denmark
1060.95
0.44%
Figure 1 Eel aquaculture production of the world's top six
countries in 2012 (Unit: t)
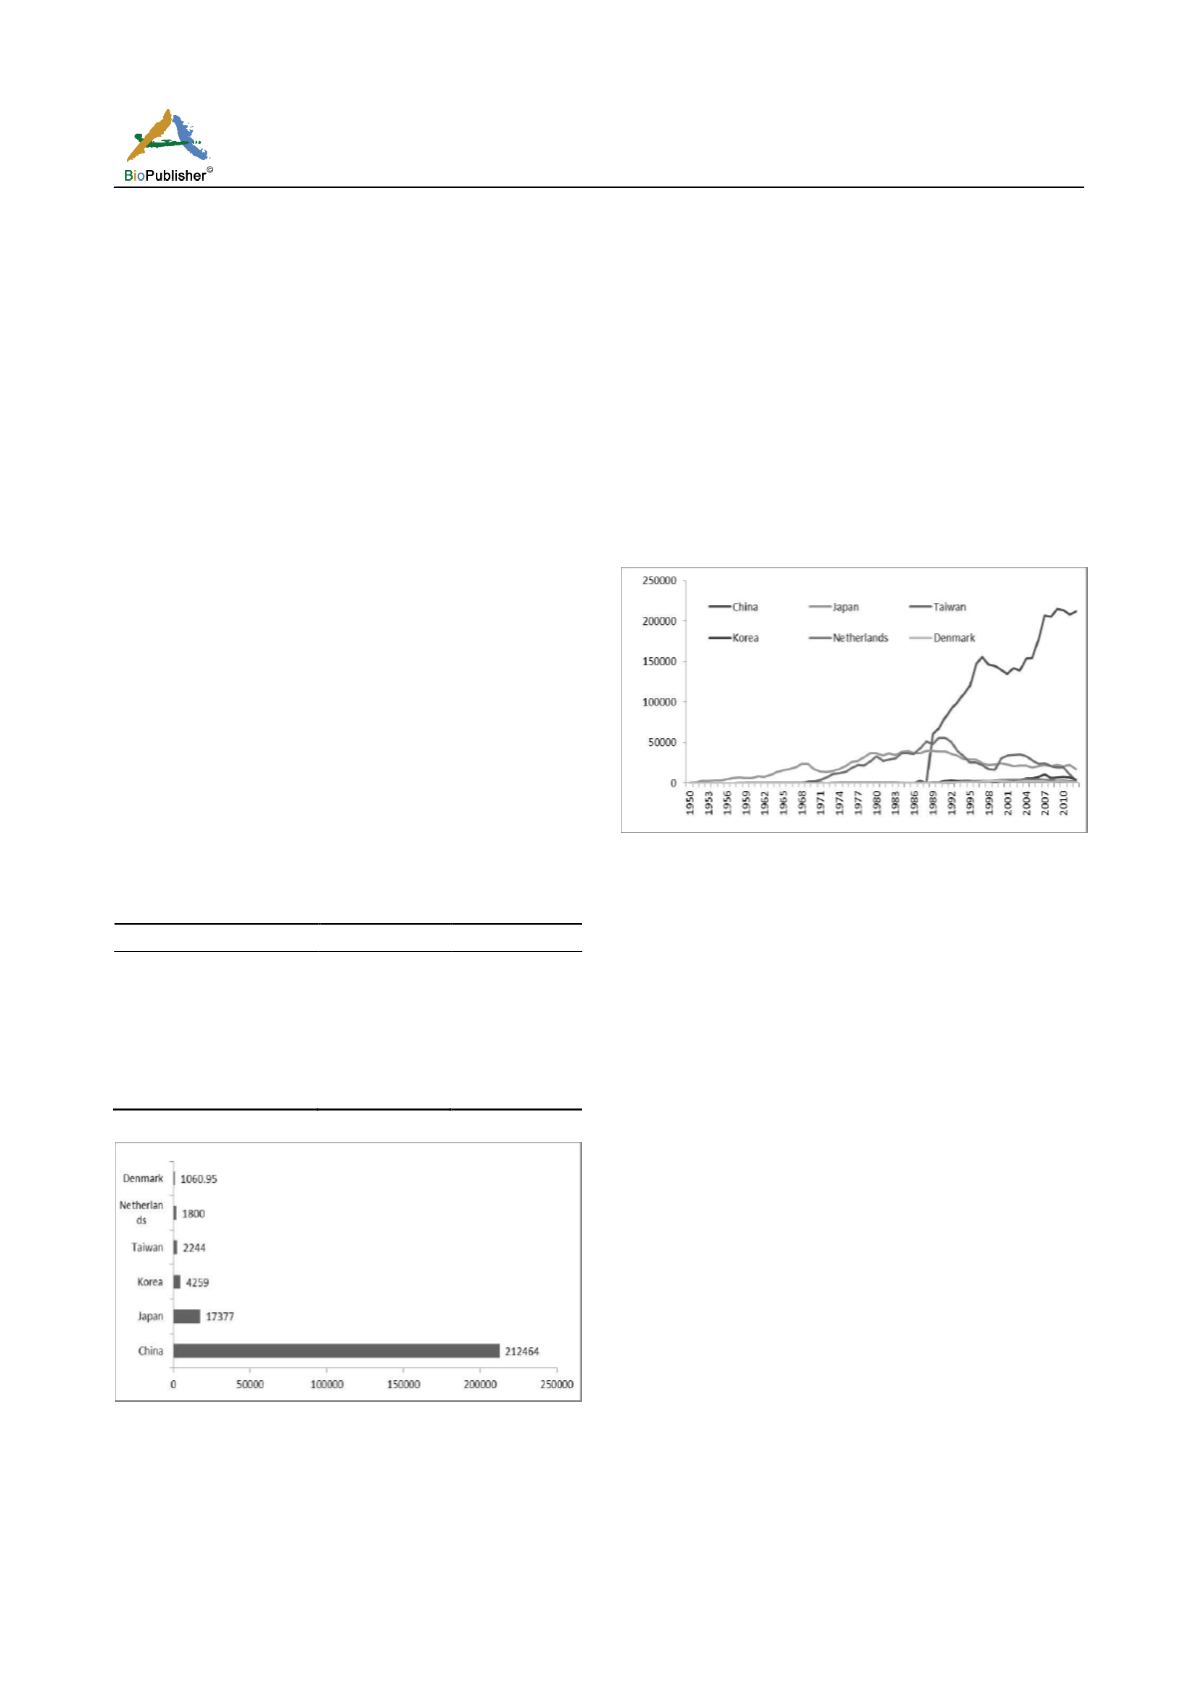
Figure 2 shows that the global eel aquaculture
producing countries (regions) are constantly changed
with time in the history. Generally, it can be divided
into two stages: the first stage is from 1950 to 1989,
the global eel aquaculture is mainly concentrated in
Japan and Taiwan; the second stage is from 1989 to
2012, the global eel aquaculture is mainly
concentrated in China. In the history of global eel
aquaculture industry, the maximum eel aquaculture
production in Japan, China and Taiwan were 39,704
Metric tons (1989), 214,698 Metric tons (2009) and
55,816 Metric tons (1990). The largest share of eel
aquaculture production in total global for Japan, China
and Taiwan were 94.74% (1965), 52.41% (1988) and
88.06% (2012).
Figure 2 Eel aquaculture production Changing tendencies of
the world's top six countries (1950-2012). Quantity Metric tons
Japan is one of the earliest countries to report its eel
aquaculture production (area) to FAO, eel aquaculture
in Japan begins in 1879. It has been about more than
130 years of history. In 1950, the Japanese eel
aquaculture production was 339 Metric tons,
henceforth, eel aquaculture production rising steadily
year by year. For a long time, Japan eel fry resources
cannot meet the needs of eel aquaculture industry. In
1964, Japan began to import eel fry from China,
Taiwan and Korea which increasing the amount of eel
fry into the pool, and then the Japan’s eel aquaculture
production rose more obviously in the subsequent
period. In 1969, due to the outbreak of the "gill kidney
disease", the eel aquaculture production showed a
substantial decrease. Eel aquaculture production didn’t
begin to rebound until 1973. In 1989, the Japan’s eel
aquaculture production soared to 39,704 Metric tons,
which is the highest production point in Japan’s eel
aquaculture history. After 1989, due to the impact of
rapid development of China's eel aquaculture industry,
Japan’s eel aquaculture production showed a declined
trendy and fell below 20,000 Metric tons in 2005. In
order to protect the development of Japan’s eel


