International Journal of Marine Science 2015, Vol.5, No.13, 1-11
5
Table 2 Summary of variation in the number of colonizing individuals and species
No. of colonizing individuals
No. of colonizing species
Range
Mean ±SD
Range
Mean±SD
Cage 1
27
-
35
31±3.65
5
-
11
8±2.12
Cage 2
2
-
49
24±21.55
1
-
9
5±3.64
Cage 3
1
-
28
9±11.17
1
-
11
4±4.16
Cage 4
3
-
28
12±10.57
3
-
8
5±2.35
Cage 5
9
-
23
16±5.15
5
-
6
5±0.90
Although 12 individuals were sampled from cage 2 in
the month of February, the number decreased
remarkably to 2 in the month of March, while the
month of April recorded 13 individuals and a further
increase to 49 was observed in May. However, the
number recorded for July decreased to 46. In cages 3,
4 and 5 number of colonizing individuals did not
follow any particular pattern. In cage 3, while the
highest number (28) of colonizing individuals was
recorded in March, the least number (1) occurred in
May. The number of individual macroinvertebrates
was highest in the month of April for Cage 4, while
the lowest number (3) was collected in the months of
March and May. In cage 5, although the number of
individuals recorded decreased (18 to 14) between
February and May, colonizing individuals increased to
23 in July.
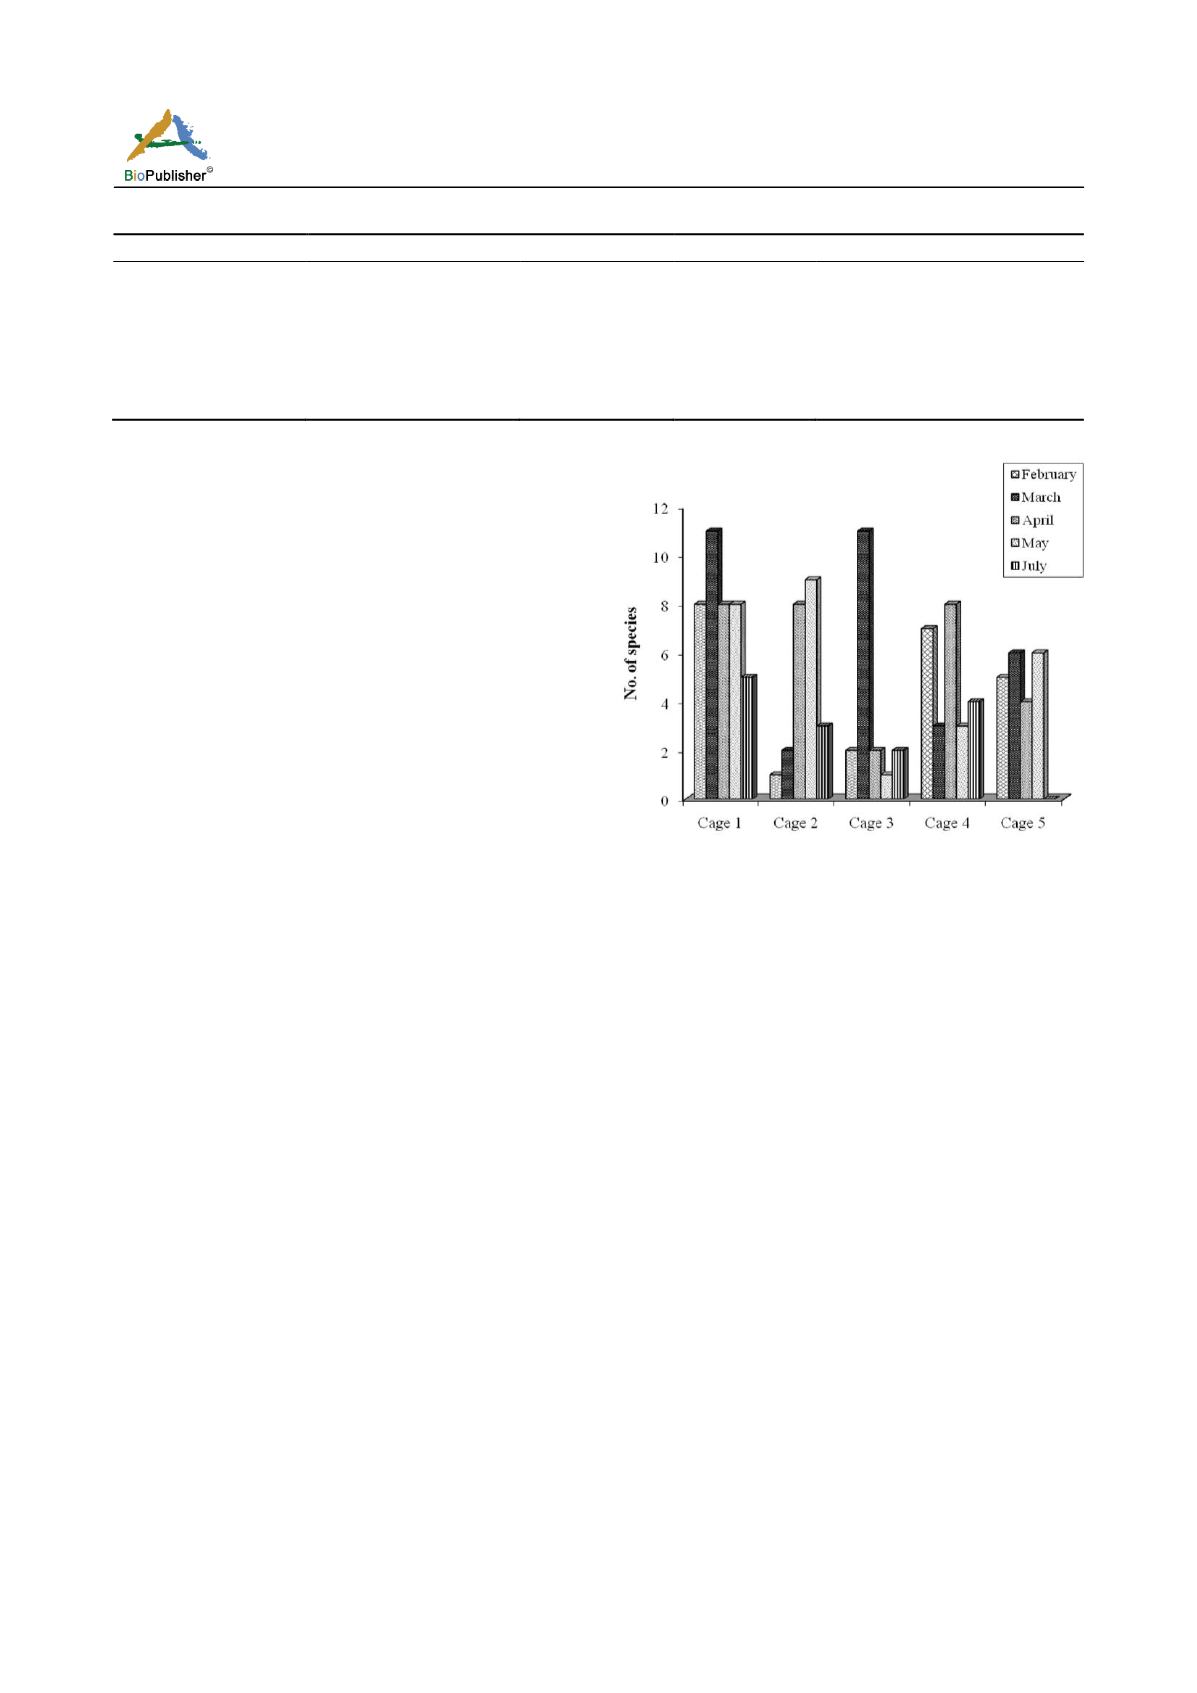
2.3Variation in the number of colonizing species
Eighteen macroinvertebrate species were recorded in
the five cages used for this experiment. In overall, the
control cage recorded the highest average number (8)
of colonizing species at a time, while the least number
(4) was observed in cage 3. Cages 2, 4 and 5 recorded
average of five species each. Analysis of temporal
variability in the number of species observed in the
experimental cages shows that there was a progressive
decrease in the number of colonizing species after the
second month (Table 2; Figure 5). In cage1, eight
species were recorded in the first month of study, this
number increased to eleven in the second month after
which there was a reduction in following three months
in the order of eight species (April and May) to five in
July. Number of species in cage 2 increased
progressively from a singe species observed in
February to nine species in May after which there was
a drastic decrease to three in July.
Cage 3 recorded two species in the month of February,
11 in the month of March, two, one and two in the
months of April, May and July respectively. In cage 4,
Figure 5 Monthly variation in the number of colonizing species
in experimental cages
number of colonizing species were at its peak in the
months of February (7 species) and April (8 species),
while the months of March (3 species), May (3
species) and July (4 species) recorded relatively lower
numbers. Five species were enumerated in cage 5 in
the first month of observation, this number increased
to six in March then a decrease to four species in April,
and subsequent increase to six in the month of May.
No species was recorded in the month of July in cage 5.
2.4 Pattern of colonization by different
macroinvertebrate groups
Colonizing macroinvertebrate groups were not
different from the known resident species. However,
pattern of variation in the number of individuals of
colonizing species were remarkably different (Table 3).
The assemblage recorded in this experiment was
defined by the populations of two bivalve molluscs
(
Macoma cumana, Tellina nymphalis
), two gastropods
mollusc (
Pachymelina aurita, Tympanotonus fuscatus
)
and two crustacean arthropods (
Clibanarius africanus,
Penaeus notialis
). In the overall the bivalve mollusc
M.
cumana
dominated in the number of individuals with


