International Journal of Marine Science 2015, Vol.5, No.13, 1-11
4
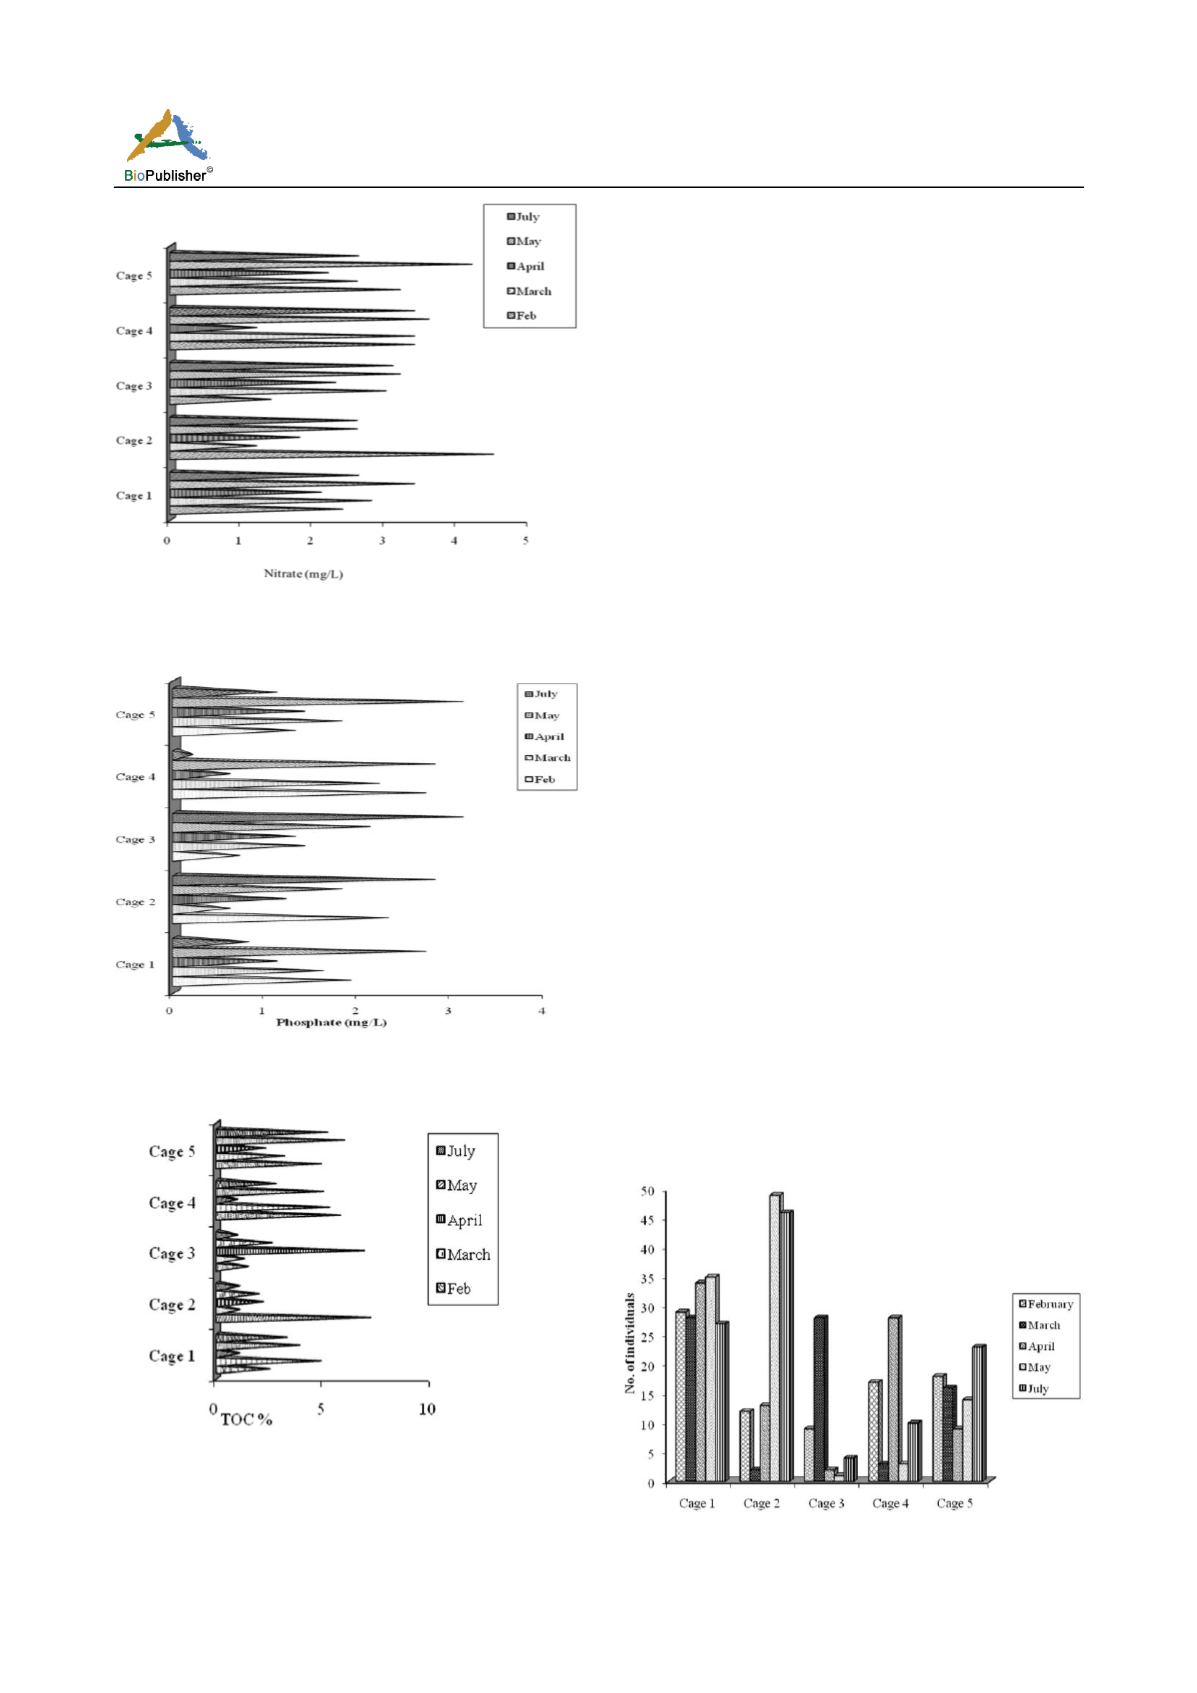
Figure 1 Variation in nitrate concentration in experimental
cages
Figure 2 Variation in phosphate concentration in experimental
cages
Figure 3 Variation in percentage TOC in experimental cages
range of 1.2 – 3.4 was recorded in cage 4 while nitrate
values in cage 5 varied between 2.2 – 4.2 mg/L. In
cage 1, a range of 2.2 – 3.4 mg/L and mean value of
2.7 mg/L were recorded. Cages 2 and 3 recorded mean
values of 2.6 and 2.6 as well as ranges of between
1.2–4.5 and 1.4–3.2 mg/L respectively. Mean
concentration of phosphate in cages 2–5 were the
same (1.7 mg/L), while in cage 1 a mean value of
1.6 mg/L was recorded. Values recorded ranged from
0.8 to 2.7 mg/L in cage 1, 0.6 to 2.8 mg/L in cage 2,
0.7 to 3.1 mg/L in cage 3, 0.2 to 2.8 mg/L in cage 4,
and 1.1 to 3.1 mg/L in cage 5. Total organic content
(TOC) varied between 1.1–4.9 % in cage 1, 1.1–7.2 %
in cage 2, 1.0–6.9 % in cage 3, 1.0–5.8 % in cage 4,
and 2.3–6.0 % in cage 5. Concentrations of nutrients
and percentage TOC in experimental cages were not
significantly different.
2.2 Variation in the number of colonizing individuals
A total of three hundred and twenty-four individuals
of macroinvertebrates were recorded in this
experiment. Cage 1, which is the control cage, had the
highest number (153) of individuals, followed by cage
2 with 122 individuals. Cages 3, 4 and 5 recorded 41,
61 and 80 individuals respectively. Analysis of the
monthly number of individuals colonizing the cages
indicates that the number of macroinvertebrates in the
control cage was higher (Table 2; Figure 4). There was a
steady increase in the number of macroinvertebrates in
cage 1 throughout the study period except in the months
of March and July. The number (28) recorded in March
was a unit lower than the number (29) recorded in
February, while 27 individuals were recorded in the
month of July. The number of individuals recorded in
cage 1 increased from 34 in April to 35 in May. The
trend recorded for cage 2 was similar to the pattern
observed in cage 1.
Figure 4 Monthly variation in the number of colonizing
individuals in experimental cages


