International Journal of Marine Science 2016, Vol.6, No.28, 1-9
2
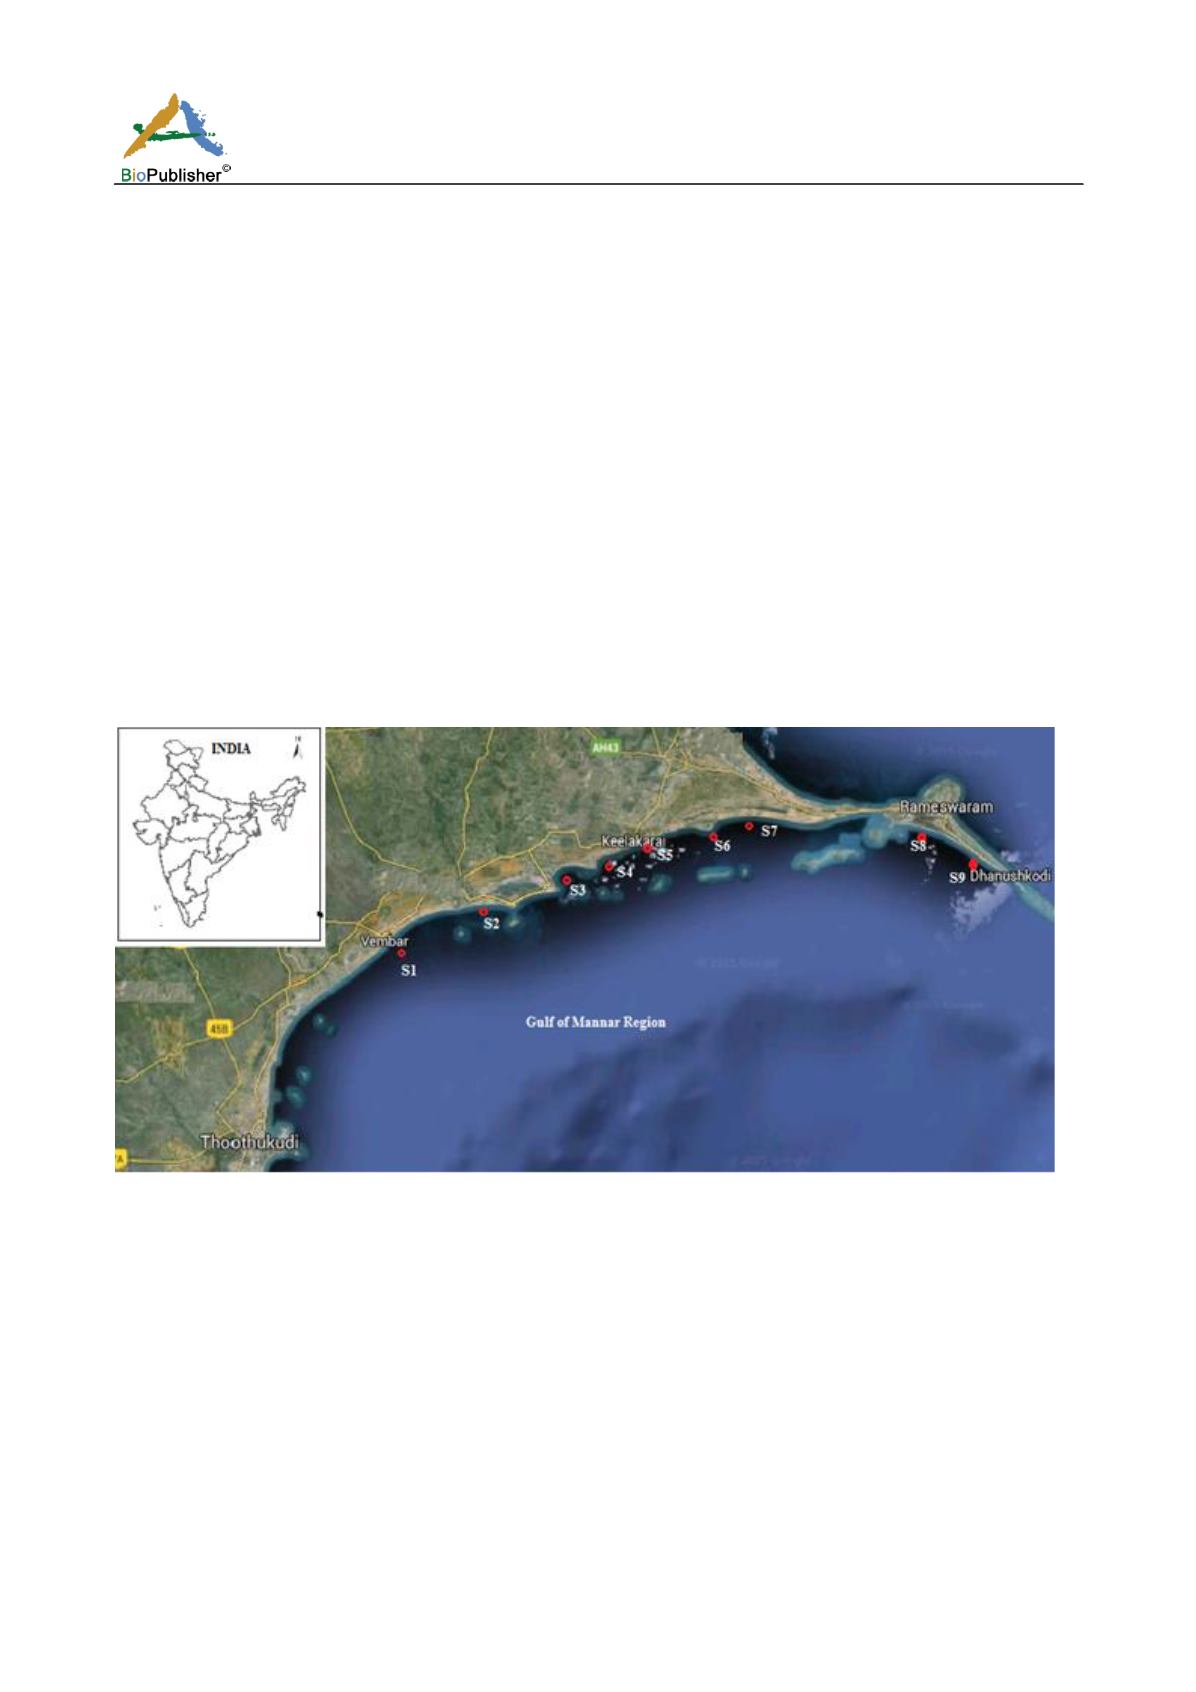
2 Materials and Methods
Sampling was carried out by using a Hydro-Bios zooplankton net from nine stations [S1=Vembar; S2=
Periyakulam; S3=Valinoakkam; S4=Ervadi; S5=Keelakarai; S6=Periyapattinam; S7=Pudumadam; S8=
Rameswaram; S9= Dhanushkodi] (Fig. 1). The net had a mouth diameter of 0.5 m diameter and mesh size of 150
μm. A flowmeter was mounted at the center of the mouth to estimate the volume of the water filtered through the
net. The net was towed obliquely from the surface. The collected plankton was transferred to 500 ml polythene
containers and immediately preserved using 5% buffered formalin. Atmospheric and surface water temperature
was measured using a standard centigrade thermometer. Salinity and pH were estimated with the help of a
refractometer (ERMA, Japan) and ELICO grip pH meter respectively. The dissolved oxygen was estimated by the
modified Winkler’s method (Strickland and Parsons, 1972). The inorganic nitrate, nitrite, phosphate and reactive
silicate were estimated according to Strickland and Parsons 1972. In the laboratory, preserved zooplankton
samples were transferred into large petri dishes and the macro zooplankton like hydromedusa and large fish larvae
were removed and then the specimens were sorted and identified up to species level by using standard
monographs (Sewell 1929; Davis 1955; Kasturirangan 1963; Smith 1977; Santhanam and Srinivasan. 1994). For
quantitative analysis, known quantity of zooplankton samples were placed on the
Sedgewick
Rafter
Counting
chambers
and counts were converted into the number of individuals per m
3
for each station and they were
observed under stereo zoom microscope (make: Nikon SMZ800). Biodiversity, taxa and evenness were calculated
as per Shannon and Weaner (1949), Gleason (1922) and Pielou (1966).
Fig.
1 Map showing study area. S1=Vembar; S2=Periyakulam; S3=Valinoakkam; S4= Ervadi; S5= Keelakarai; S6= Periyapattinam;
S7= Pudumadam; S8= Rameswaram; S9= Dhanushkodi
2.1 Statistical analysis
To find the similarity between the zooplankton groups a Hierarchical agglomerative clustering approach (CA) was
employed and the results were illustrated as a dendrogram. CA was performed on the standardized data by means
of Ward’s method, using squared Euclidean distances as a measure of similarity. Principal component analysis
(PCA) was employed with respect percentage of composition to correlate the relationship among the zooplankton
and stations.
3 Results and Discussion
Atmospheric temperature was recorded in the range between 30.3 and 33.5°C with an average value of 32.25 ±
1.05 °C from all the stations. The minimum temperature was observed at station 1 and maximum temperature was
observed from station 8. Whereas Surface water temperature was observed in the range between 30.1 and 34 °C
with on average value of 32.1 ±1.16 °C with the minimum surface temperature was noticed in station 1 and


