International Journal of Marine Science 2016, Vol.6, No.28, 1-9
7
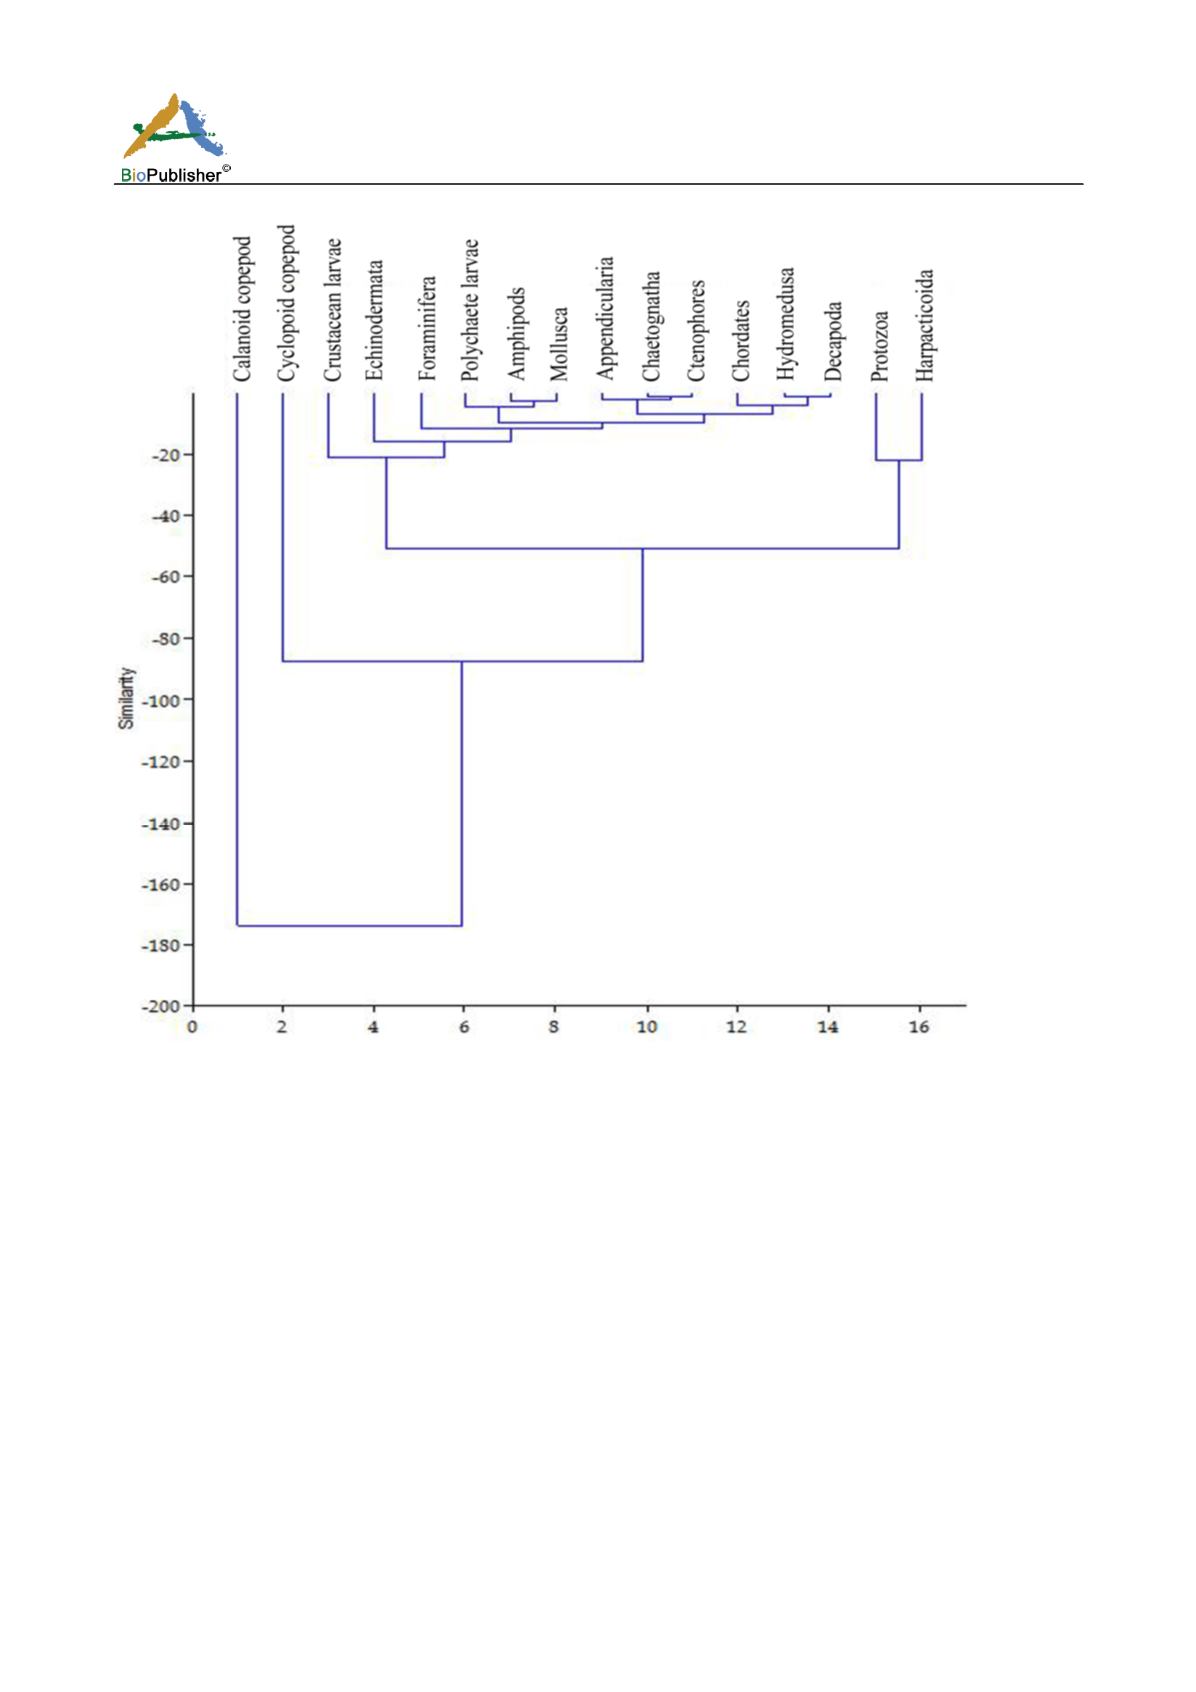
Fig. 3 Dendrogram of the sixteen groups of zooplankton species measured by Euclidean distances showing the degree of relative
dissimilarity of distribution between species in the water masses of the study area
3.1 Species association
The Euclidean distance usually provides the similarity between two samples, and a distance can be represented by
the difference between analytical values of the samples. The species association of the sixteen groups was
measured by normalized Euclidean distances. A dendrogram showing the species association is illustrated in Fig.3.
Species with similar horizontal distribution formed a cluster or close clusters. For instance, all the 16 zooplankton
groups form 5 clusters with respect to percentage of distribution. Harpacticoid copepod and ciliate form a cluster,
to which several groups
are joined. These species are common to all water masses. Several species were extinct or
rare in the coast but relatively most of the species were common and abundant in sampling sites, e.g., amphipods,
molluska, appendiculariae, chaetognatha, ctenophores and decapoda, are joined to close clusters at the middle of
the dendrogram. Among all species in linkage calanoid copepod and cyclopoid copepod has highest distance with
all others which forms an outer group in the dendogram.
The present study also found that, Stations 1 and 3 are negatively correlating with each other with respect to
distribution of zooplankton species Fig. 4. Stations 4 & 9 are positively correlating with each other indicates
that the zooplankton species are similar with observe to their family member abundance at this stations. From
this plot it was observed that stations 2, 1 and 6 are differing from all other sites. Statistical analysis reveals


