Basic HTML Version


International Journal of Marine Science 2014, Vol.4, No.47, 1-11
http://ijms.biopublisher.ca
5
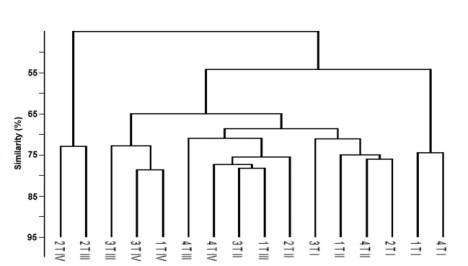
Figure 3 Dendrogram of hierarchical clustering (group –
average linking) for the macrofauna collected from all transects
during different seasons (1, 2, 3, 4)
The multivariate methods were employed to find out
the influence of environmental parameters on the
distribution of infaunal macrofauna of Vellar estuary.
To measure the agreement between the biological
(Bray-Curtis similarity) and environmental (Euclidean
distance) matrices, the harmonic rank correlation was
applied. Four environmental variables were allowed to
match the biota including temperature (
℃
), salinity,
dissolved oxygen (ml L
-1
) and organic carbon (mg g
-1
).
The results of the best combinations are given in Table
3. The maximum correlation found (0.757) indicated a
good match between the biotic and environmental
variables. The serial change in species composition
throughout the estuary was studied using the
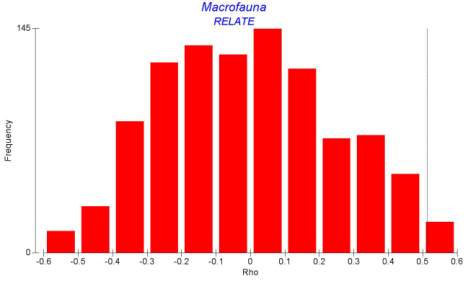
Spearman rank correlation (Rho). Rho value obtained
was 0.513 (Figure 4) with the sample statistic of 1.1 %
indicated significant changes in species composition
with the increase of distance from the estuarine mouth.
Table 3 Harmonic rank correlation
(ρ) between macrofauna and
environmental variables
No. of
variables
Best variable combinations
Correlation
(ρ)
2
Dissolved oxygen, organic carbon
0.757
2
Temperature, dissolved oxygen
0.743
2
Temperature, organic carbon
0.729
2
Temperature, salinity
0.711
3
Temperature, dissolved oxygen, salinity 0.661
3 Discussion
The bottom water temperature recorded in the present
study varied from 21.4±0.2 to 38.2±0.9
℃
, similarly
earlier investigations of this estuary were found to be
lower 26-32
℃
by Ajmal Khan et al. (1975); 24-31
℃
by Chandran et al. (1982); 24-36˚C by Fernando (1987)
Figure 4 Histogram showing the result of seriation for samples
collected from Vellar estuary
and 26-32˚C Murugasan et al. (2007). Temperature
maximum was found to be higher than in previous
studies of Vellar estuary (Table 4) probably due to the
change of climatic condition or global changes in
temperature due to the increasing amount of CO
2
level.
However, the seasonal temperature pattern was found
to be similar to those found in previous studies of
Vellar estuary (references). Similarly to previous
records, the higher temperatures were recorded in
summer, while lower temperatures were associated
with monsoon season (Table 4). There was a steady
increase in temperature during summer, which peaked
in May and very low temperature was recorded during
monsoon. All stations showed a similar trend with
similar seasonal variations. Generally, surface water
temperature is influenced by the intensity of solar
radiation, evaporation, freshwater influx and cooling
and mixing up with the ebb and flow from adjoining
neritic waters. In the present study, summer peaks and
monsoonal dip water temperatures were similar to
those reported in India (Saravanakumar et al., 2007).
In the present study, the maximum of bottom water
salinity was observed during summer season in
transect I (
40.2±0.2
) and the minimum salinity was
recorded during monsoon season in transect IV
(
2.6±0.4
). These values were comparatively higher
those found in previous observations by Ajmal Khan
et al. (1975) and Chandran et al. (1982) in marine
zone; Fernando (1987) including partially freshwater
zone and Murugasan et al. (2007) in tidal zone (Table
4). The salinity acts as a limiting factor in the
distribution of living organisms, and its variation
caused by dilution and evaporation influences the
fauna most likely in the intertidal zone (Kundu et al., 2010).