International Journal of Marine Science 2014, Vol.4, No.47, 1-11
            
            
              http://ijms.biopublisher.ca
            
            
              4
            
            
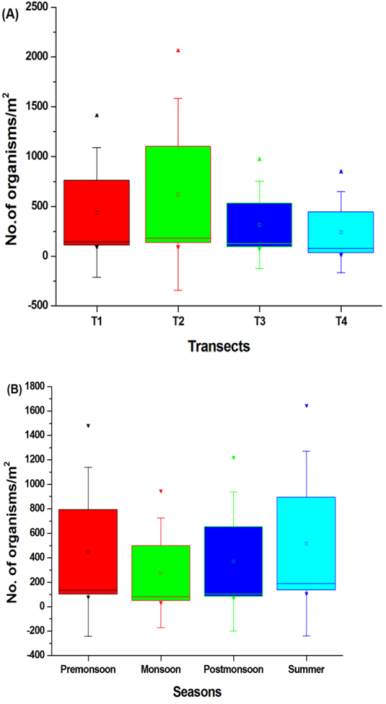
              Figures 2 (A) Abundance of macrofauna in different transects
            
            
              (B) various seasons
            
            
              (
            
            
              Data presented as mean (squares), ±1 SE
            
            
              (boxes) and ±1 SD (whiskers). Upside-up triangles: maximum;
            
            
              down- triangles: minimum)
            
            
              rend. The similar patterns were found in all the
            
            
              univariate indices with maximum during summer
            
            
              season and minimum during monsoon season except
            
            
              Pielou’s evenness expressed opposite trend (see Table 2).
            
            
              In multivariate methods, cluster analysis was
            
            
              employed to know the similarity between the
            
            
              sampling transects as well seasons based on
            
            
              macrobenthic abundance data. The results of cluster
            
            
              analysis for all the samples are shown in Figure 3.
            
            
              Totally, five different groups were formed in the
            
            
              cluster analysis. The first group formed between
            
            
              postmonsoon-2008 and premonsoon-2007 with the
            
            
              higher percentage of 79.8% within transects IV
            
            
              (partially freshwater zone) followed by postmonsoon-
            
            
              2008 of transect II (artificial mangrove environment-
            
            
              tidal zone) premonsoon-2007 and of transect III
            
            
              (oyster bed - tidal zone) were clustered with the level
            
            
              of 79.3%, summer-2008 of transect II (artificial
            
            
              mangrove environment-tidal zone) and monsoon-2007
            
            
              of transect I (marine zone) grouped with percentage of
            
            
              75.2%, the fourth group formed within the transect I
            
            
              (marine zone) between premonsoon-2007 and
            
            
              summer-2008 with the level of 74.8% and last group
            
            
              was found within the monsoon season between
            
            
              transects IV and III with level of 73.5%. Among this
            
            
              fourth group was combined together with all other
            
            
              groups (55.1%) while the last group shared with all
            
            
              other groups (45.2%).
            
            
              Table 2
            
            
              Diversity indices of macrofauna in the study area during 2007-2008
            
            
              Seasons
            
            
              Transects
            
            
              S
            
            
              N
            
            
              H' log
            
            
              d
            
            
              J′
            
            
              1-Lambda′
            
            
              Premonsoon-2007
            
            
              Transect I
            
            
              31
            
            
              388
            
            
              2.688
            
            
              5.695
            
            
              0.4743
            
            
              0.892
            
            
              Transect II
            
            
              43
            
            
              760
            
            
              2.602
            
            
              7.071
            
            
              0.3136
            
            
              0.8703
            
            
              Transect III
            
            
              27
            
            
              390
            
            
              2.146
            
            
              4.931
            
            
              0.3168
            
            
              0.7561
            
            
              Transect IV
            
            
              12
            
            
              288
            
            
              1.946
            
            
              2.354
            
            
              0.5347
            
            
              0.786
            
            
              Monsoon-2007
            
            
              Transect I
            
            
              20
            
            
              406
            
            
              1.945
            
            
              3.576
            
            
              0.3497
            
            
              0.7683
            
            
              Transect II
            
            
              20
            
            
              374
            
            
              2.255
            
            
              3.632
            
            
              0.4767
            
            
              0.8566
            
            
              Transect III
            
            
              19
            
            
              214
            
            
              2.43
            
            
              4.01
            
            
              0.5977
            
            
              0.8815
            
            
              Transect IV
            
            
              11
            
            
              140
            
            
              2.037
            
            
              2.278
            
            
              0.6969
            
            
              0.8396
            
            
              Postmonsoon-2008
            
            
              Transect I
            
            
              35
            
            
              432
            
            
              2.433
            
            
              6.325
            
            
              0.3256
            
            
              0.8251
            
            
              Transect II
            
            
              33
            
            
              522
            
            
              2.396
            
            
              5.751
            
            
              0.3326
            
            
              0.8434
            
            
              Transect III
            
            
              26
            
            
              220
            
            
              2.448
            
            
              5.023
            
            
              0.4449
            
            
              0.8586
            
            
              Transect IV
            
            
              14
            
            
              228
            
            
              1.907
            
            
              2.745
            
            
              0.481
            
            
              0.7552
            
            
              Summer-2008
            
            
              Transect I
            
            
              37
            
            
              514
            
            
              2.746
            
            
              6.488
            
            
              0.4211
            
            
              0.8936
            
            
              Transect II
            
            
              46
            
            
              816
            
            
              2.718
            
            
              7.486
            
            
              0.3295
            
            
              0.8575
            
            
              Transect III
            
            
              29
            
            
              390
            
            
              2.667
            
            
              5.31
            
            
              0.4963
            
            
              0.8769
            
            
              Transect IV
            
            
              15
            
            
              344
            
            
              1.946
            
            
              2.72
            
            
              0.4666
            
            
              0.7723
            
            
              Note: S- number of species, N- number of individuals, H' log- Shannon-Wiener index,
            
            
              d- Margalef richness, J′- Pielou’s evenness
            
            
              index,
            
            
              1-Lambda′
            
            
              - Simpson index