Basic HTML Version


International Journal of Marine Science 2014, Vol.4, No.42, 1-11
http://ijms.biopublisher.ca
5
In contrast to the pattern displayed by transparency,
turbidity values were lowest in station 1 and highest in
station 3. In station 1, a range of 28 – 80 NTU and a
mean value of 50.85 NTU were recorded, while values
observed for stations 2 and 3 ranged from 10 to 70
NTU (mean = 54.5 NTU) and between 3 and 180
NTU (mean = 69.67 NTU) respectively were recorded.
The depth of the study stations varied directly with the
turbidity. While a mean value of 173.16 cm was
measured in station 1, higher values of 196.16 cm for
station 2 and 317.5 cm for station 3 were recorded.
2.2 Community structure of benthic macroinvertebrates
Two major macroinvertebrate groups (Annelida and
Mollusca) were identified from a total density of 7820
ind/m
2
benthic macroinvertebrate in the study area.
Mollusca was the most abundant group with density
of 7800 ind/m
2
(comprising 65 % gastropoda and
approximately 35 % of bivalves) and accounted for
99.7 % of the total macroinvertebrate density. It was
represented by 2 classes, 4 families and 7 species.
Among the molluscs observed, the estuarine gastropod
Pachymelania aurita
was the most abundant with a
density of 2540 ind/m
2
and accounted for 33 % of
molluscan population. Also significantly represented
in the molluscan group is another estuarine gastropod
Tympanotonus fuscatus
which accounted for 23.2 %
(density 1810 ind/m
2
) of mollusc population. Other
gastropods recorded include
T. fuscatus
var
radula
(7 %; 540 ind/m
2
) and
Neritina glabarata
(1 %; 80
ind/m
2
). Among the bivalves
Tellina nymphalis
(13 %;
990 ind/m
2
) dominated in abundance while
Aloides
sp
(11 %; 840 ind/m
2
) ranked second and
Macoma
cumana
constituting 10.89 % with a population
density of 820 ind/m
2
was the least contributor.
Annelida was represented by 20 specimens (Constituting
200 ind/m
2
) of
Nereis lamellose
and accounted for 3%
of the total benthic macroinvertebrate population.
2.3 Spatial and temporal variations in density and
diversity of macroinvertebrates
High variability in fauna density and diversity at
spatiotemporal scales was observed in this study
(Figures 2~5). Although there was no significant
difference (ANOVA, F = 0.722,
P
< 0.05) in the
monthly density of benthic macroinvertebrates
recorded, significant difference (ANOVA, F = 8.282,
P
> 0.05) was observed in the density of benthic
macroinvertebrate recorded in study stations. A
post-hoc
test using Turkey’s Test shows that density of
benthic macroinvertebrates were significantly higher
and similar in stations 1 and 3 than station 2. Of all the
stations used for this study, station 1 recorded the
highest density (410 ind/m
2
) and number (8) of
species, while stations 2 and 3 recorded 105 ind/m
2
,
seven spp and 270 ind/m
2
, six spp respectively.
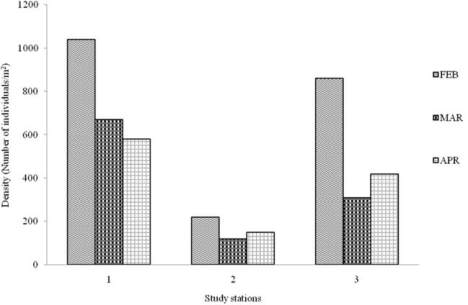
Figure 2 Variation in density of benthic macroinvertebrates in
the study stations during the dry season
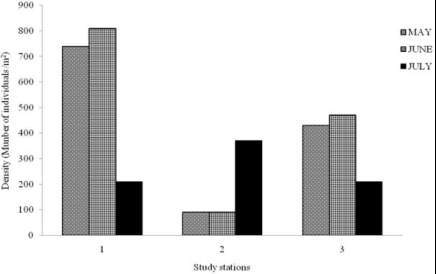
Figure 3 Variation in density of benthic macroinvertebrates in
the study stations during the wet season
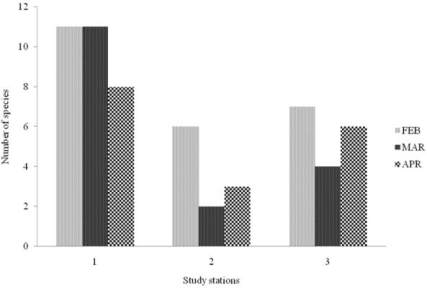
Figure 4 Variations in the number of benthic macroinvertebrtae
species recorded at the study stations during the dry season.