Basic HTML Version


International Journal of Marine Science 2014, Vol.4, No.42, 1-11
http://ijms.biopublisher.ca
4
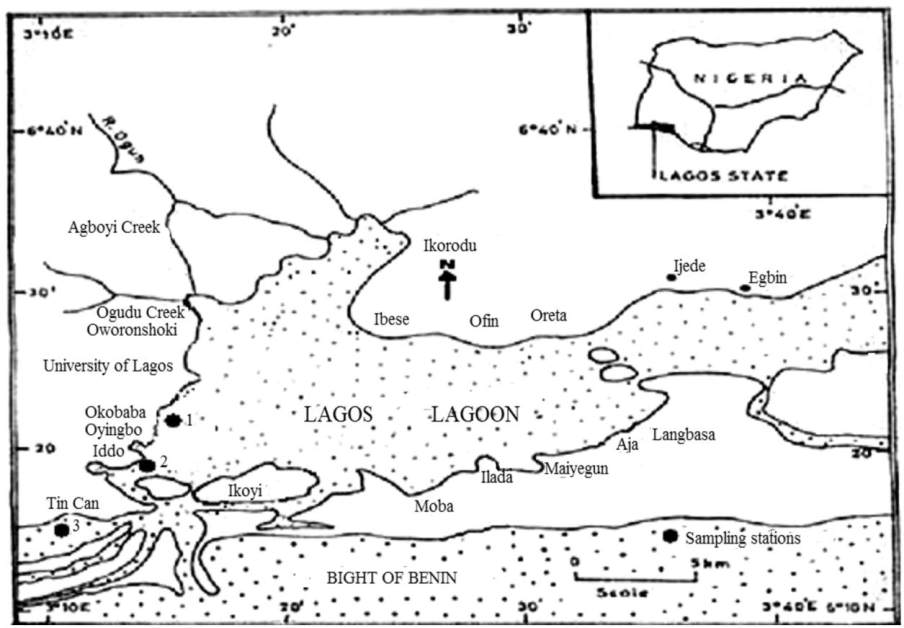
Figure 1 Lagos Lagoon showing the sampling stations
Edmunds (1978) and Barnes (1988). The numbers of
taxa and individuals for each station were counted and
recorded for all the sampling months. Chlorophyll
samples were filtered through Whatman
glass-fibre
filter
and extracted in acetone in the dark and under
refrigeration (Holm-Hansen, 1978; Daemen, 1986).
Chlorophyll
a
was determined fluorometrically.
1.3 Statistical analysis
One-Way analysis of variance (ANOVA) was used to
determine variations in environmental conditions at
the study stations. When significant variations are
detected, a
post hoc test
using Duncan New Multiple
Range Test (DMRT) in the case of physico-chemical
variables and Turkey’s Test in the case of biotic
variables were performed to determine the locations of
significant differences. The following ecological
parameters were assessed to describe the structure and
composition of benthic macroinvertebrates; density =
number of individuals per 0.1 m
2
(ind/m
2
), diversity =
number of species of benthic macroinvertebrates.
2 Results
2.1 Physical environmental factors
Summary of physical conditions in the study sites is
presented in Table 1. Overall trends in variables
investigated were relatively inconsistent for study
sites. Water transparency was highest in station 1
where a range of 3 – 6 cm and a mean value of 88.8
cm were recorded. In station 2, the value of
transparency varied between 9.3 and 32 cm and a
mean of 23.46 was observed. Transparency in station
3 was lowest, ranging between 8 and 23 cm with a
mean value of 14.0 cm.
Table 1 Summary of physical conditions at the study sites
Factor
1
2
3
Min Max Mean±SD
Min Max Mean±SD
Min Max Mean±SD
Transparency(cm) 3 60 88.8 ±24.54
9.3 32 23.46 ±9.06
8 23 14.0 ±5.78
Turbidity (NTU)
28 80 50.85 ±18.98
10 70 54.5 ±75.42
3 180 69.67 ±58.54
Depth (cm)
83 96 173.16±147.07
96 365 196.16±94.21
131 570 32.5±18.92