International Journal of Marine Science, 2017, Vol.7, No.33, 316-343
323
the true impact of the JR fishery in the WC, the results presented here indicate that this marine area is important
for the hawksbill population dynamics, as well as its management and conservation.
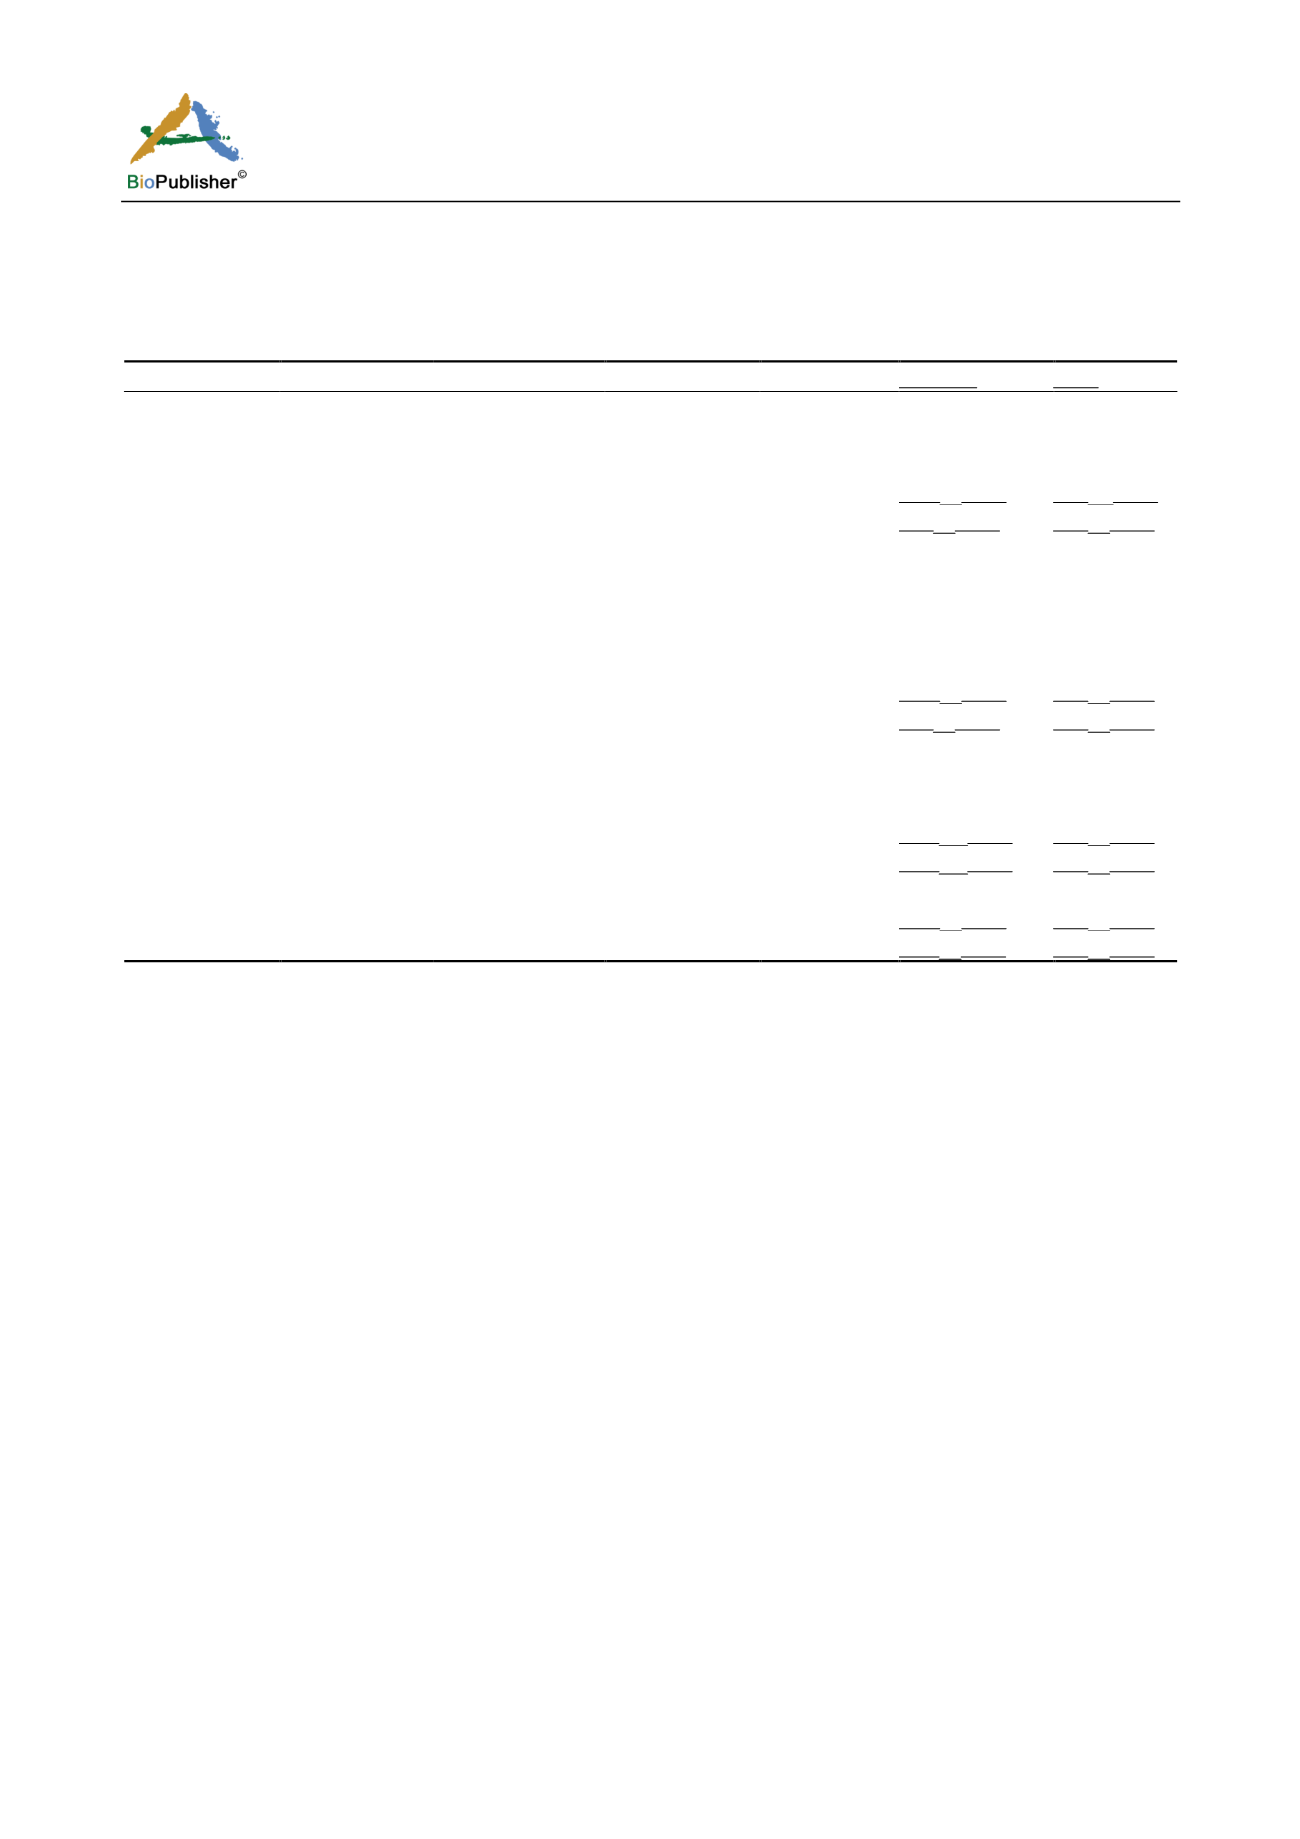
Table 3 Correlation between maritime distances and the natural logarithm of the contribution for 384 and 740 bp regarding only
Jardines del Rey or all aggregations
Decade or year
Maritime distance Non adult
Adult
Non adult
Adult
Jardines del Rey
(384 bp)
1990s
SMD
-0.14
(14)
/ 0.64
0.27
(14)
/ 0.35
TMD
-0.21
(14)
/ 0.46
0.05
(14)
/ 0.86
2004
SMD
-0.06
(14)
/ 0.84
TMD
-0.10
(14)
/ 0.74
-0.01
(14)
/ 0.98
0.27
(14)
/ 0.35
2005
SMD
-0.09
(14)
/ 0.76
0.20
(14)
/ 0.50
0.15
(14)
/ 0.61
TMD
-0.06
(14)
/ 0.82
2000s
SMD
0.22
(14)
/ 0.44
TMD
0.17
(14)
/ 0.55
Jardines del Rey
(740 bp)
2004
SMD
-0.04
(13)
/ 0.90
TMD
0.42
(13)
/ 0.15
2005
SMD
-0.15
(13)
/ 0.62
-0.02
(13)
/ 0.93
0.27
(13)
/ 0.37
TMD
0.22
(13)
/ 0.47
0.36
(13)
/ 0.19
0.34
(13)
/ 0.25
2000s
SMD
0.27
(13)
/ 0.37
TMD
0.37
(13)
/ 0.21
All aggregations
(384 bp)
1990s
SMD
-0.09
(112)
/ 0.32
0.23
(56)
/ 0.09
TMD
-0.16
(112)
/ 0.09
0.11
(56)
/ 0.41
-0.11
(196)
/ 0.13
0.17
(56)
/ 0.20
2000s
SMD
-0.13
(126)
/ 0.14
0.07
(28)
/ 0.71
-0.11
(196)
/ 0.14
0.08
(56)
/ 0.54
TMD
-0.10
(126)
/ 0.26
0.01
(28)
/ 0.98
All aggregations
(740 bp)
2000s
SMD
-0.15
(104)
/ 0.14
0.11
(26)
/ 0.58
-0.15
(96)
/ 0.15
0.16
(21)
/ 0.50
TMD
-0.06
(104)
/ 0.56
0.13
(26)
/ 0.52
-0.11
(96)
/ 0.28
0.19
(21)
/ 0.40
Note: The correlations (Pearson coefficient
(N)
/ probability) obtained from MSAgr are underlined. SMD: shortest maritime distance
between rookeries and aggregations, TMD: maritime distance between rookeries and aggregate assuming a sea turtle trajectory
similar to that is of the passive dispersion of particles on regional ocean currents (Blumenthal et al., 2009a)
The independence between haplotype frequencies per SCL class and maturation category, the relatively high
values of genetic diversity, and the absence of historical records of nesting in JR, enable the confirmation of this
fishing aggregation as very diverse both phenotypically (Carrillo et al., 1998b) and genetically (Díaz-Fernández et
al., 1999). Likewise, these elements corroborate the JR fishing ground as a suitable corridor for the reproductive
migration of adult individuals and those at the height of the sexual maturity (Lee-González et al., 2015), or those
that are migrating to other WC feeding aggregations. The temporal independence of the genetic composition as
well as of the SCL class is yielded by the prevalence of the most distributed haplotypes in WC (EiA01 and EiA11,
Leroux et al. (2012)), and the existence of other low frequency haplotypes.
The temporal independence of the genetic composition in each maturation category has also been reported in the
Mona Island feeding ground, particularly for juveniles newly recruited to the platform and for breeding males
(Velez-Zuazo et al., 2008). This apparently would indicate that the haplotype mixtures do not depend of the type
of aggregation (
i.e.
breeding or feeding ground). However, the composition of maturation categories and size
classes does vary depending on the structural characteristics of the marine area in question. In breeding
aggregations, mating turtles have SCLs close to the average value in each sexual class (Miller, 1997) due to the
reduced growth in this life stage (van Dam and Diez, 1998a). In feeding aggregations, the heterogeneity and
abundances of SCL classes and life stages is a function of the available trophic resources and structural niches
(León and Diez, 1999; Blumenthal et al., 2009b). Therefore, when the juveniles remain as residents for a long
time (van Dam and Diez, 1998b; Meylan et al., 2011), the area should support a specific number of individuals
with varying degrees of consumption according to their sizes (Diez and van Dam, 2002). In contrast, our study
area is a corridor of
E. imbricata
which has experienced a temporary increase in the proportion of immature
individuals in the smaller SCL classes (60.1-70.0 cm, Lee-González et al. (2015)). This is a reflection of the


