Molecular Plant Breeding 2015, Vol.6, No.19, 1
-
7
4
Table 4 Population assignment test performed among
Dracocephalum thymiflorum
populations. (Populations 1-5 are according to
Table 1).
Individual
Current
Inferred
Lik_max
Lik_home
Lik_ratio
4
Pop1
Pop2
-23.926
-25.549
3.246
7
Pop1
Pop5
-26.101
-32.602
13.001
8
Pop1
Pop3
-16.963
-19.496
5.066
11
Pop1
Pop5
-21.642
-32.599
21.914
20
Pop2
Pop4
-16.313
-27.538
22.45
25
Pop3
Pop1
-19.69
-27.619
15.857
34
Pop3
Pop5
-9.223
-9.563
0.68
35
Pop3
Pop5
-9.852
-14.766
9.829
37
Pop4
Pop1
-19.111
-19.687
1.153
39
Pop4
Pop1
-15.373
-20.054
9.362
43
Pop4
Pop3
-16.088
-19.049
5.921
45
Pop4
Pop5
-11.343
-13.402
4.116
49
Pop5
Pop3
-10.303
-20.741
20.876
52
Pop5
Pop4
-10.819
-21.147
20.655
54
Pop5
Pop4
-22.7
-24.325
3.25
55
Pop5
Pop1
-22.094
-35.684
27.179
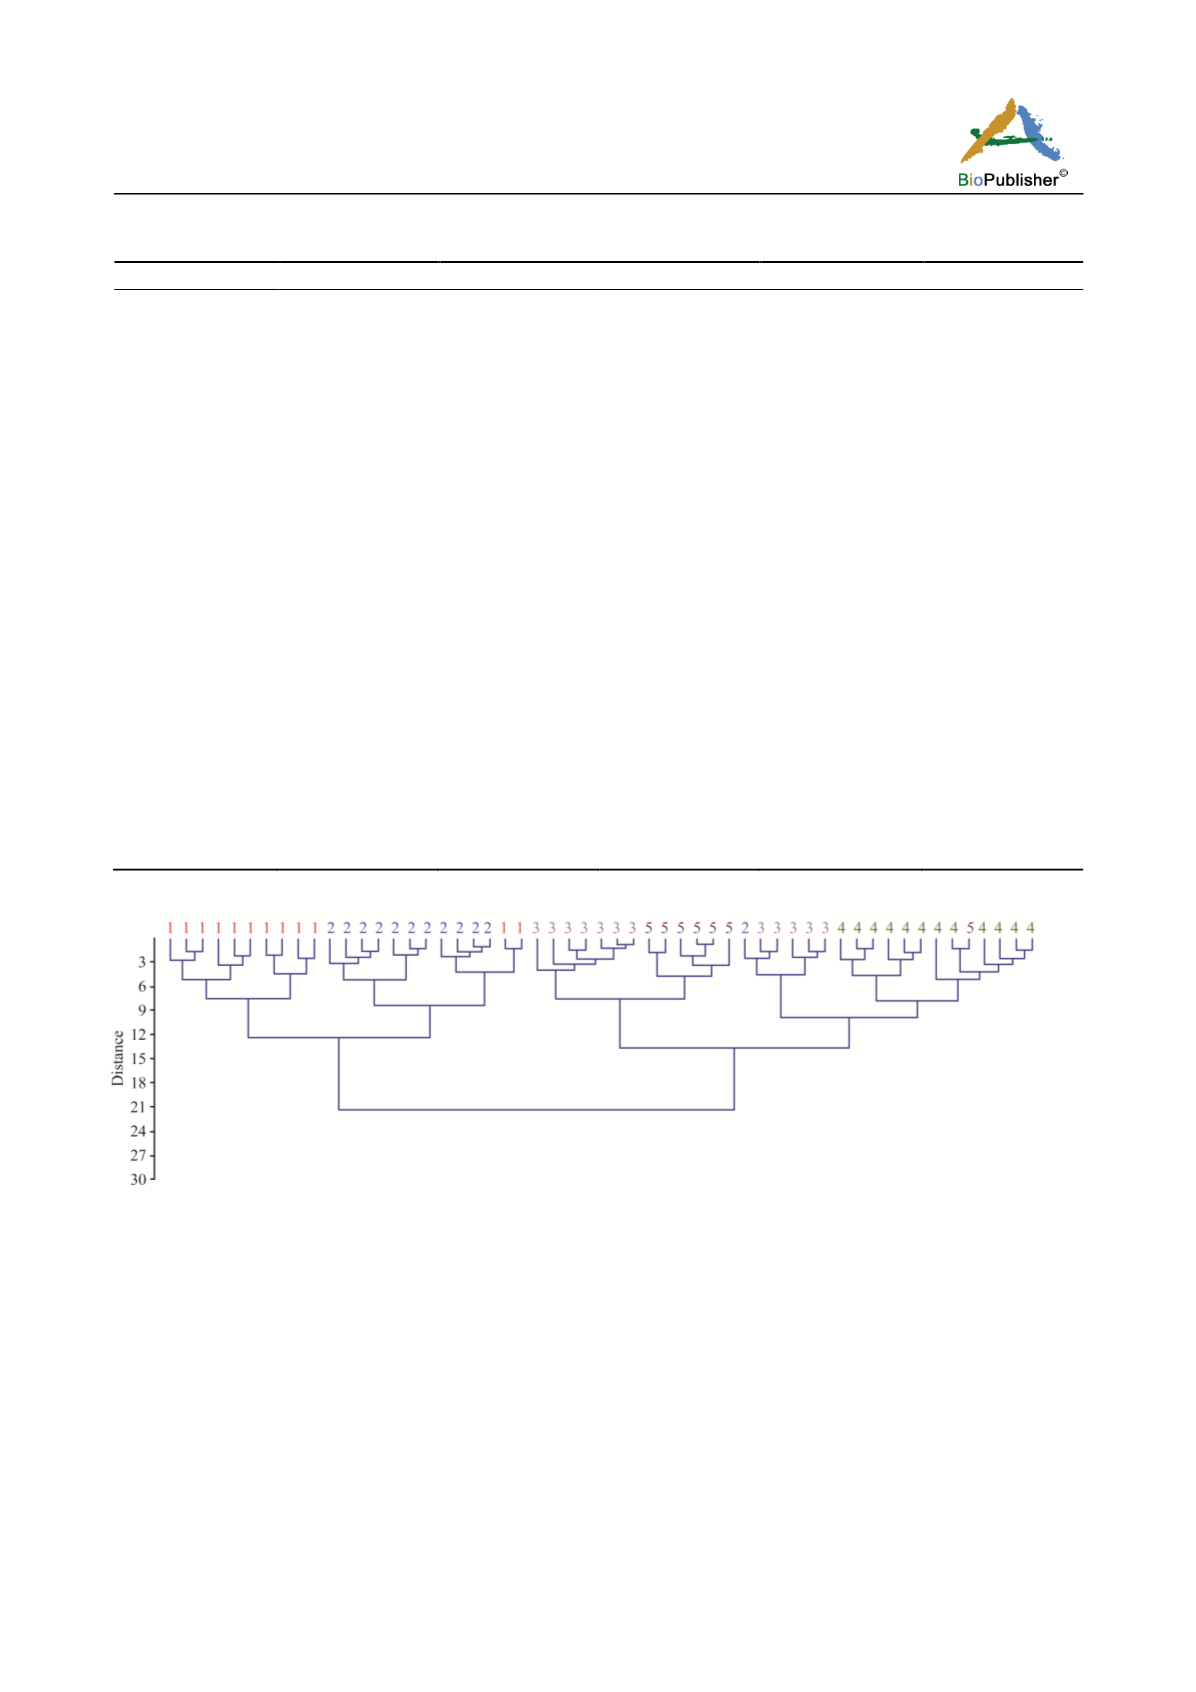
Figure 2 Ward dendrogram of
Dracocephalum thymiflorum
populations. (Populations 1-5 are according to Table 1).
population genetic variation have been used to prioritize
for conservation efforts (Petit et al
.
,1998) with, all else
being equal, more weight given to those populations
exhibiting higher levels of within-population variation,
and to those that are more genetically divergent from
others. In our study the population 2 was genetically
differentiated from the other studied populations and
also contained a high degree of within population
genetic variability.
These populations may have increased likelihood of
persistence over less variable population and hence the
ability of a population to contribute demographically to
the species through time, and have increased adaptability
in the face of future environmental change.
The STRUCTURE plot and population assignment
revealed some degree of genetic admixture among the
studied
Dracocephalum thymiflorum
populations.
Therefore, in spite of population differentiation, limited
gene flow occurred among these populations.


