Molecular Plant Breeding 2015, Vol.6, No.17, 1
-
22
4
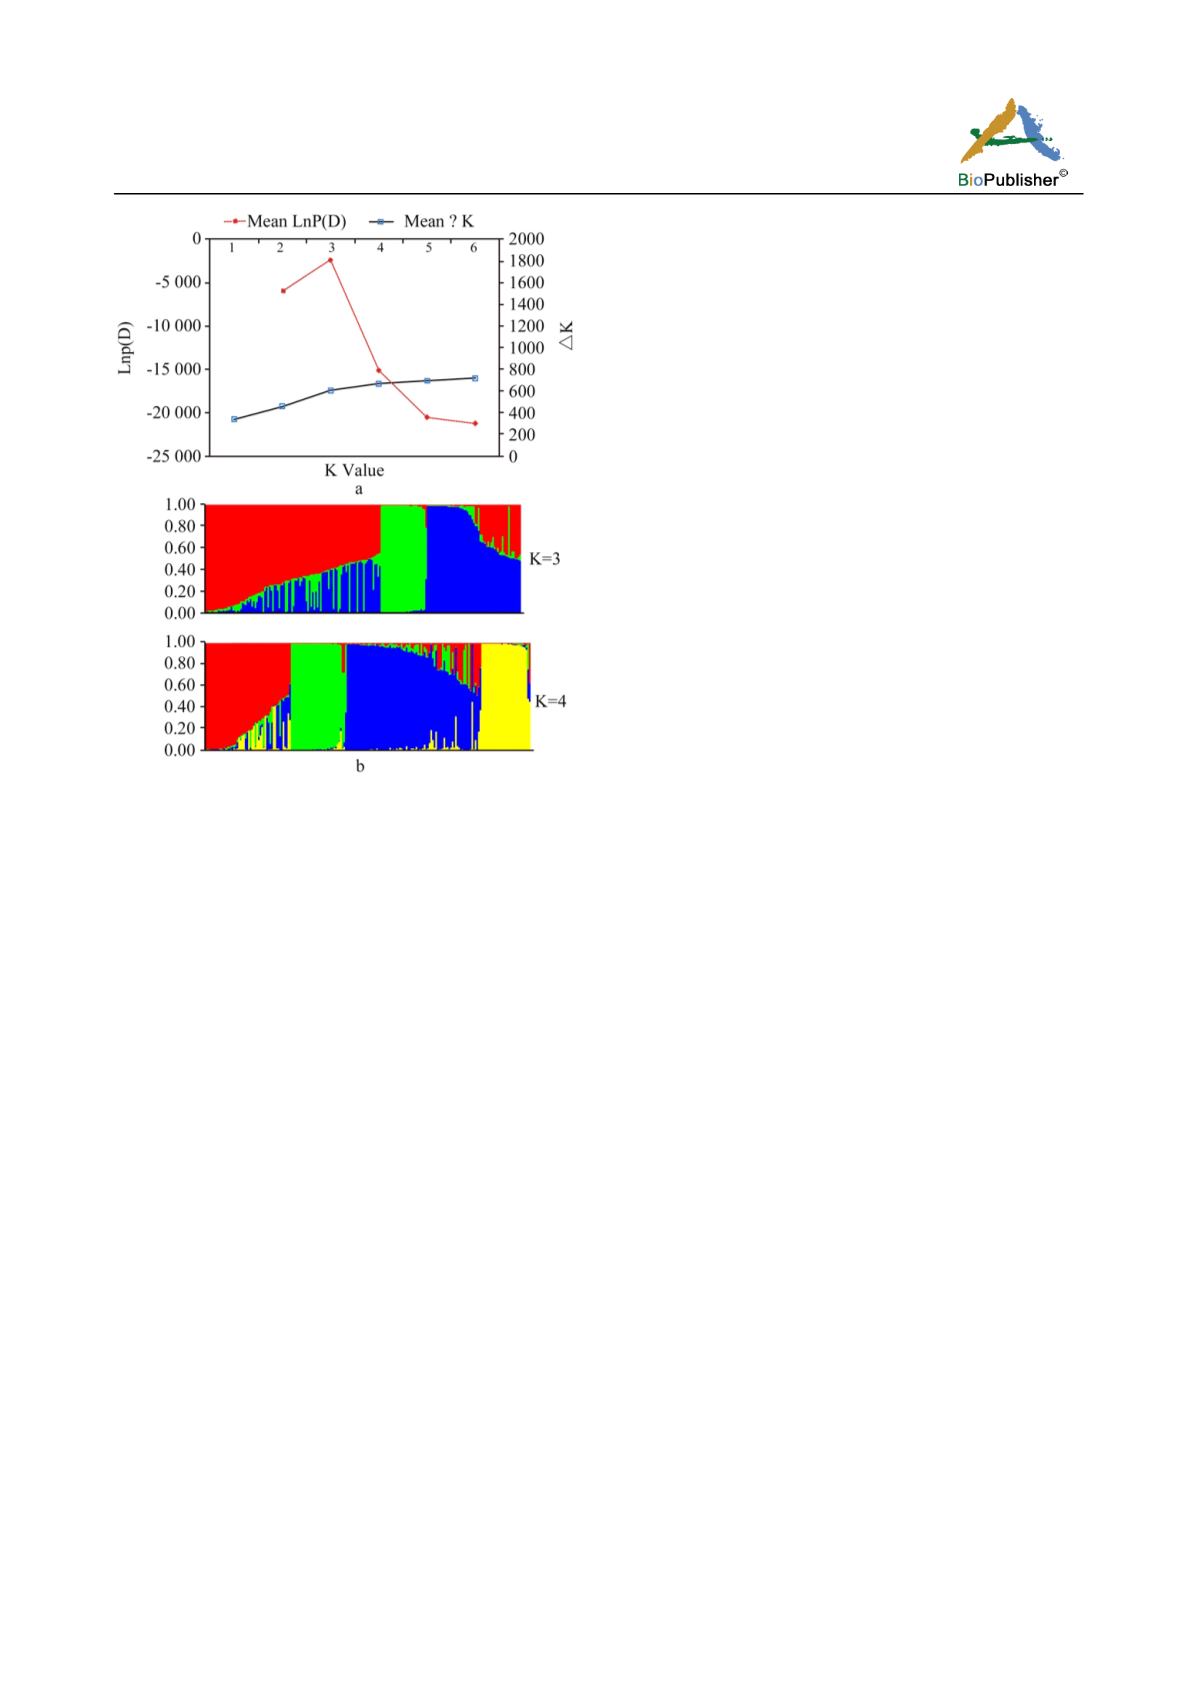
Figure 4 Population structure of 184 genotypes based on 227
alleles from 56 SSR markers: a) Plot of LnP (D) and ∆K
calculated for K ranging between 1 and 6, with each K
represented by a mean of 3 repeats
b) Population structure of the 184 genotypes at K =3 and K =4.
Each individual is represented by a single vertical line that is
partitioned into K coloured segments, with lengths proportional
to the estimated probability membership to each of the K
inferred clusters.
1.4 Discriminant analysis
The reliability of the different groups obtained
through the model-based population structure and
cluster analyses was assessed through discriminant
analyses using the group membership from both
methods as categorical variables. The discrimination
model with the stepwise procedure identified 12
alleles from 11 SSRs as the best explanatory variables
for the priori group defined at K = 3 and 22 alleles
from 21 SSRs for the prior groups obtained using
cluster analysis (Table 1 and 2 shows the list of SSR
alleles that were chosen by the stepwise discriminant
analyses). The Mahalanobis distance matrix from
pairwise comparisons of the 3 groups obtained from
STRUCTURE at K=3 ranged from 4.0 to 37.0 and
they were all significant, with group 3 being 2 to 11
times more distant from all others.
The Mahalanobis distance between groups obtained
using cluster analysis ranged from 9.84 to 83.4. The
commercial hybrids (CHS) were generally more
distant from all the other genotypes. Based on the
population structure, the grouping at K=3 corresponds
to the clustering based on the Rodgers genetic
distance since population 1 was equivalent to the
SPRL, population two constituted the SBRL and
SBRH which were close to one another with a
distance of 9.84 between them, and the commercial
hybrids (G4 in the dendrogram), population 3 to
SPRH and the mixed population constituted other
CIMMYT lines bred for yield and drought. The
phenotypic traits for classifying the genotypes into
resistance and susceptible was not a good indicator for
discriminating the genotypes, since the canonical
correlation coefficient (CAN1) was 0.13 and 0.26 for
the stem borer and storage pest resistance indices
respectively.
Comparisons of the different multivariate analyses
revealed high concordance among the PCA,
model-based population partition, clustering based on
the genetic distance and discriminant analyses in
terms of the number of groups and members in each
group. However, there was low concordance between
grouping based on the phenotypic data indices and the
SSR based population partitioning in assigning the
genotypes into the different groups or populations.
1.5 Analysis of molecular variance (AMOVA)
Table 3 shows the partitioning of the overall SSR
variance into hierarchical levels using AMOVA. When
AMOVA was performed using the 6 possible groups
predicted from UPGMA-cluster analyses and
population structure; and the two groups based on
storage pest resistance, the estimated fixation indices
(FST) varied from 6.49 % to 27.85%. When the
overall SSR variance was partitioned into hierarchical
levels using the groups predefined from the
model-based population partition at K = 2, K = 3, K =
4, K = 5 and K = 6 as categorical variables, FST
accounted for 15.3%, 23.8%, 25.86%, 26.56% and
27.85%, respectively. In the cluster analysis that based
on the storage pest resistance trait, FST accounted for
24.26% and 6.49% respectively. A random permutation
test indicated that the proportion of variances attributable
at all groups were highly significant (p < 0.0001).


