Molecular Plant Breeding 2015, Vol.6, No.17, 1
-
22
2
Assessment of genetic relationship and population
structure is an important tool that underpins successful
breeding programs (Mohammadi and Prasanna, 2003;
Mukhtar
et al., 2002). Genetic distance is a measure of
genetic divergence between species or between
populations within a species. Smaller genetic distances
indicate a close genetic relationship whereas large
genetic distances indicate a more distant genetic
relationship. In a breeding program, genetic gain
achieved through artificial selection is proportional to
the extent of genetic differences present in the parental
lines or populations. Thus, the correct choice of
parents can influence the outcome of selection (Bohn
et al., 1999). Depending on the objectives of a breeding
programme, breeders use different methods in selecting
the best parental combinations, including (a) pedigree
relationships, (b) morphological and agronomic traits,
(c) adaptability and yield stability, and (d) genetic
distances estimated from morphological and molecular
markers (Bohn et al
.
1999; Maric et al., 2004; Bertan
et al., 2007). Morphological and agronomic traits
were the earliest genetic markers used in germplasm
characterization and quantifying genetic distance in
crops but they have a number of limitations including low
polymorphism, low heritability, late expression during
the development process and are highly influenced by
the environment (Smith and Smith 1989).
In contrast, molecular markers, are more effective than
morphological and agronomic traits for germplasm
characterization. Genetic distance and population
structure can be estimated from various types of
molecular markers, including restriction fragment
length polymorphism (RFLP), amplified fragment
length polymorphism (AFLP), random polymorphic
DNA (RAPD), microsatellites or simple sequence
repeats (SSRs) and single nucleotide polymorphisms
(SNPs). SSR makers are widely used by maize
researchers because they are available in large
numbers in the public domain (
MaizeGDB:
,
co-dominant, multiallelic,
highly polymorphic even in closely related individuals,
can be exchanged between laboratories, and have
uniform distribution in the genome
. Although advances in marker
technology have shifted toward SNP markers,
particularly for model organisms with substantial
genomic resources, SSRs markers perform better at
clustering germplasm into populations and providing
more resolution in measuring genetic distance than
SNPs markers (Hamblin et al., 2007).
Genetic variability for resistance to field and postharvest
insect pests using phenotypic data have been reported
(Munyiri et al., 2010; Tefera, 2012). However, the
extent of genetic differences and patterns of
relationships among this germplasm and its response
to stem borer, weevil and LGB resistance has not been
well studied. The objective of this study was therefore
to understand the extent of genetic difference,
relationship and population structure across a subset
of tropical maize germplasm that has been bred for
field and storage pests’ resistance using SSR markers
and biophysical traits.
1 Results
1.1 Phenotypic evaluation
There were significant differences (P ≤ 0.001) among
the maize inbred lines and hybrids for all the
biophysical and bioassay traits measured in the study.
These traits were used to group the maize germplasm
into resistant and susceptible.
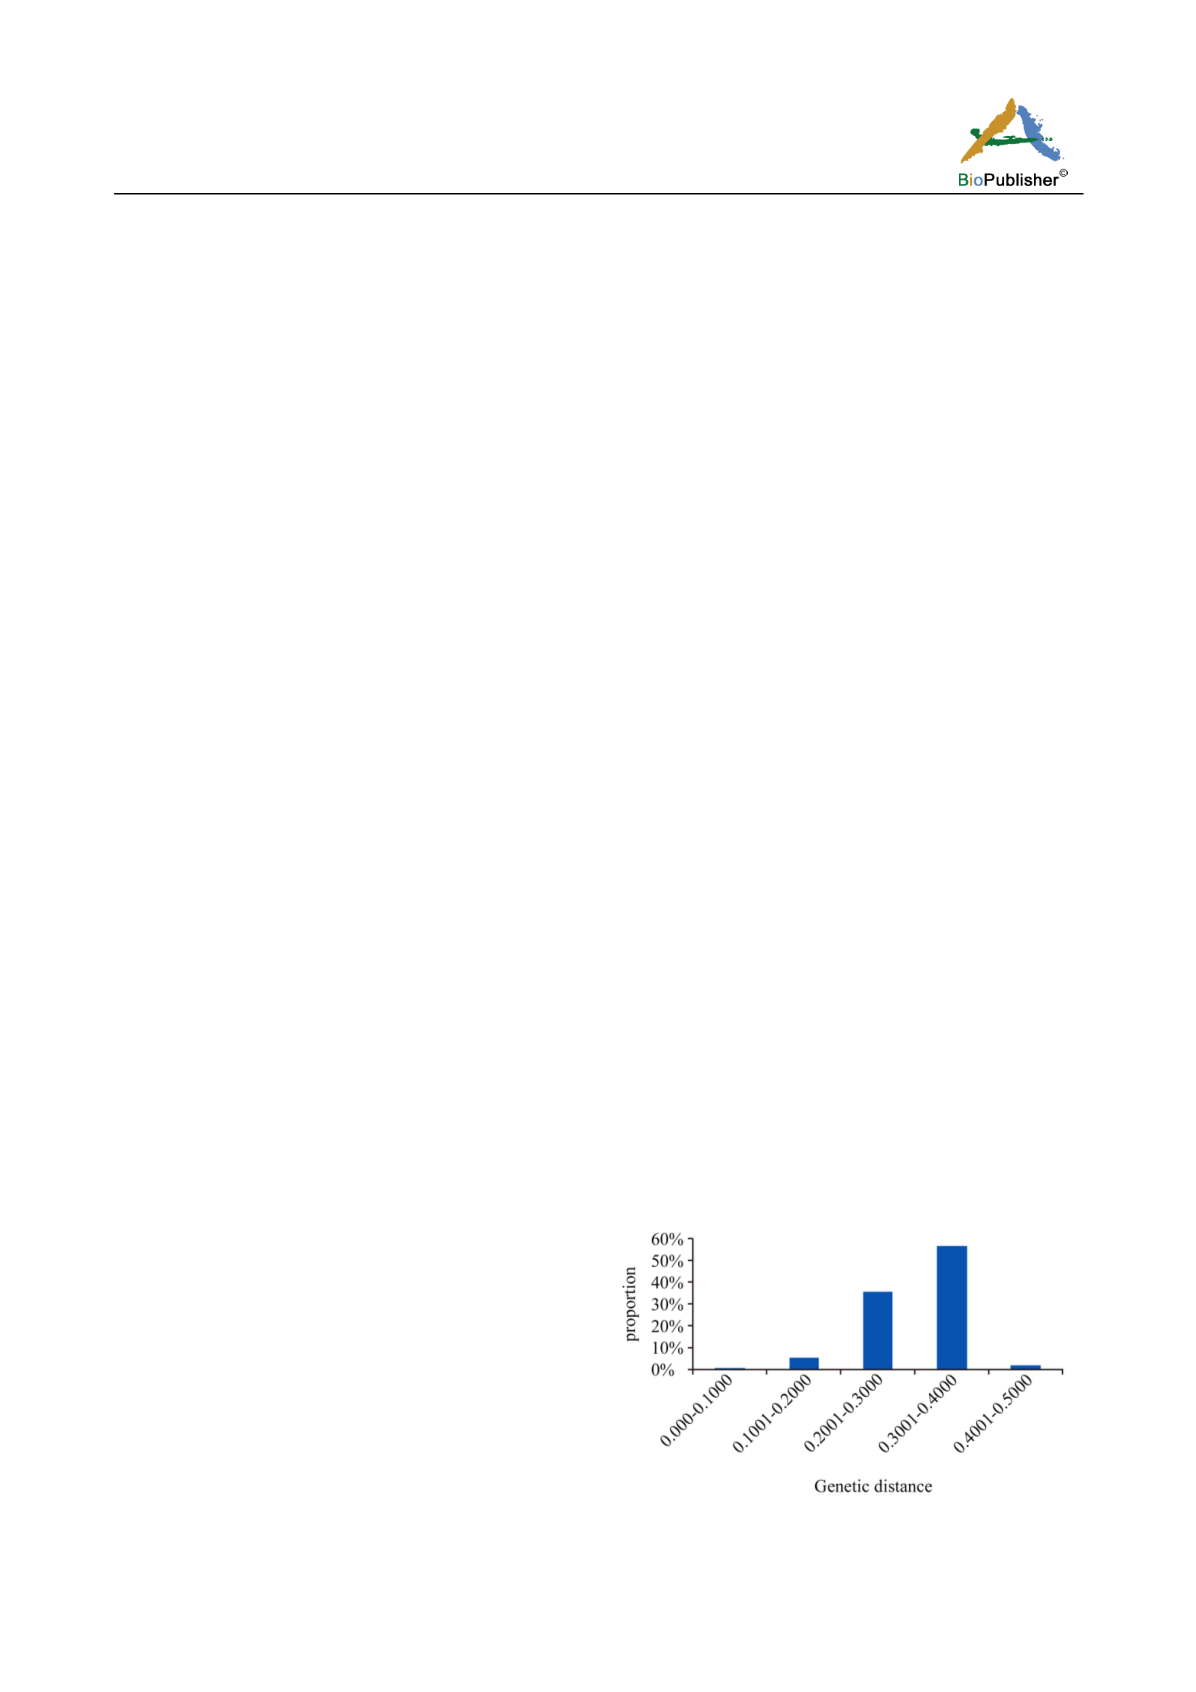
1.2 Genetic distance and relationship
Roger’s genetic distance between pairwise comparisons
of all the 184 genotypes ranged from 0.004 to 0.467,
and the overall average distance was 0.302. The vast
majority (92.4 %) fell between 0.200 and 0.400 (Figure 1).
The UPGMA tree generated from Roger’s genetic
distance matrix grouped the majority of the genotypes
into two major groups, one for inbred lines and the
other for hybrids (Figure 2). The first group had three
sub-groups (NA, G1 and G2) while the second group
had also three sub-groups G3, G4 AND G5. Sub-group
one (G1) consisted of a total of 68 inbred lines, including
Figure 1 Frequency histogram of the different genotypes based
on genetic distance


