Molecular Plant Breeding 2015, Vol.6, No.17, 1
-
22
3
Figure 2 UPGMA tree for 100 inbred lines and 84 hybrids
based on Roger’s genetic distance calculated from 227 SSR
alleles. The different groups are indicated with different colours,
and detail group membership is provided in appendix 1
29 lines that are resistant both for storage pests and
stem borers, 23 lines that are resistant only to storage
pests, 14 lines that are resistant only to stem borers,
and 2 lines that are susceptible to both storage and
field pests.
Sub-group 2 (G2) consisted of inbred lines which
have been bred for both stem borer and storage insect
pests (9 lines), stem borer resistance (15 lines) and
yield (2 lines).
In the second group which was composed of hybrids,
Sub-group 3 (G3) consisted of hybrids which had
been bred for storage pest resistance (23 hybrids),
stem borers (10 hybrids) and grain yield (5 hybrids).
Group 4 (G4) was composed of 13 commercial hybrids
from different seed companies which were all susceptible
to the storage insect, and only 4 of the 13 hybrids
showed some levels of resistance to the stem borer.
Group five (G5) consisted of 25 hybrids that were
resistant to stem borer and two hybrids resistant to
both stem borer and the storage insect pests.
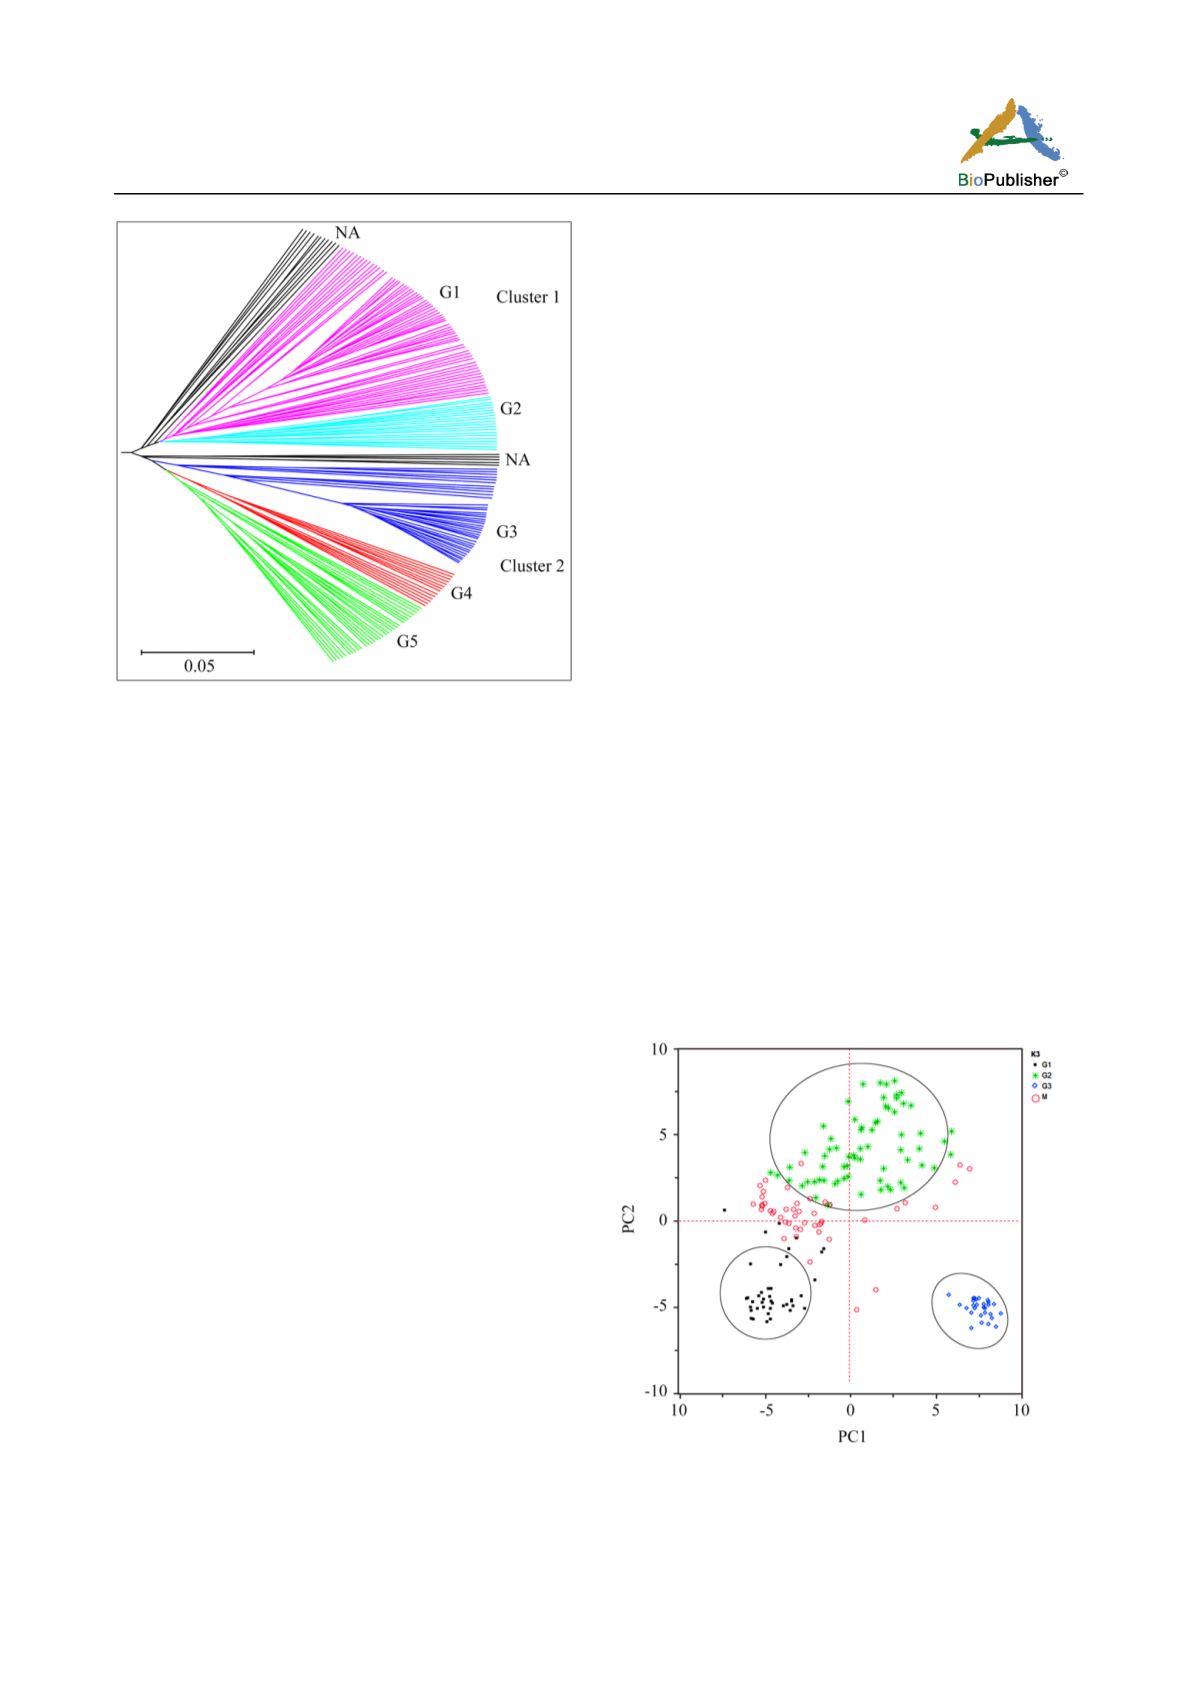
The first five principal components from principal
component analysis explained 25.7% of the total SSR
variations among samples. A plot of PC1 (8.8%) and
PC2 (7.4%) revealed 3 major groups (Figure 3) and
the pattern of grouping was the same as for the
model-based population partition at k=3.
1.3 The population structure based on SSRs
The estimated log probability of the data (LnP(D))
increased sharply between K = 1 and K = 4 (Fig 4b),
and fairly stabilized between K = 5 and K = 6 (Fig 4a).
The ad hoc statistic ΔK showed a higher likelihood
values at K = 3 (Figure 4b), with a sharp decrease when
K increased from 3 to 6 (Figure 4a). Therefore the
estimated LnP (D) and K both suggest the presence of 3
possible groups.
Assignment of genotypes into specific groups was
irrespective of the type of germplasm (inbred versus
hybrids) and generally followed their pedigree information
and their reaction to field and storage pests, with
overlapping variation with some other traits, such as
grain yield and drought tolerance. The majority of the
genotypes were assigned to group 2, which included
23 hybrids (CKIR series) and 15 inbred lines (CKSB
series) bred for stem borer resistance, 18 commercial
hybrids and other inbred lines from the CIMMYT
breeding programs. Group 1 and 3 consisted of 41
inbred lines in CKSP series and 28 hybrids in CKPH
series that were bred for storage pest resistance within
the CIMMYT breeding program. The mixed population
generally was made up of CIMMYT inbred lines bred
for yield and drought tolerance.
Figure 3 Principal component analysis (PCA) of 184 genotypes
based on 56 SSRs. The groups from PCA supports the presence
of population structure at K=3. Individuals that were assigned
in to a mixed group in the population structure analysis are
indicated in circle (red colour).


