Journal of Mosquito Research 2015, Vol.5, No.17, 1-10
5
Table 1 Dengue cases and deaths in Uttarakhand in last five years (2006 to 2010)
Year
Cases
Death
Death (%)
Increase (+/-) Cases (%) Increase (+/-) Death (%)
2006
12
1
8.3%
NA
NA
2007
21
0
0.0%
75%
-100%
2008
140
4
2.9%
567%
0%
2009
76
7
9.2%
-46%
75%
2010
4140
8
0.2%
5347%
14%
NA, Not Applicable; Table shows the percentage of increase (+/-) of cases and deaths every year in respect to the preceding year.
Table 2 Age and sex specific distribution of dengue cases in Nainital and Dehradun (combined) in 2010
Sex
No. of cases in different age groups (years)
Total
cases
Incidence Rate
(per 100000)
0-10 yrs. 11-20 yrs.
21-30 yrs. 31-40 yrs. 41-50 yrs. 51-60 yrs. 61-70 yrs.
Male
108
395
695
489
315
242
110
2354
169.9
Female 100
197
345
275
227
195
82
1421
112.3
Total
208
592
1040
764
542
437
192
3775
142.5
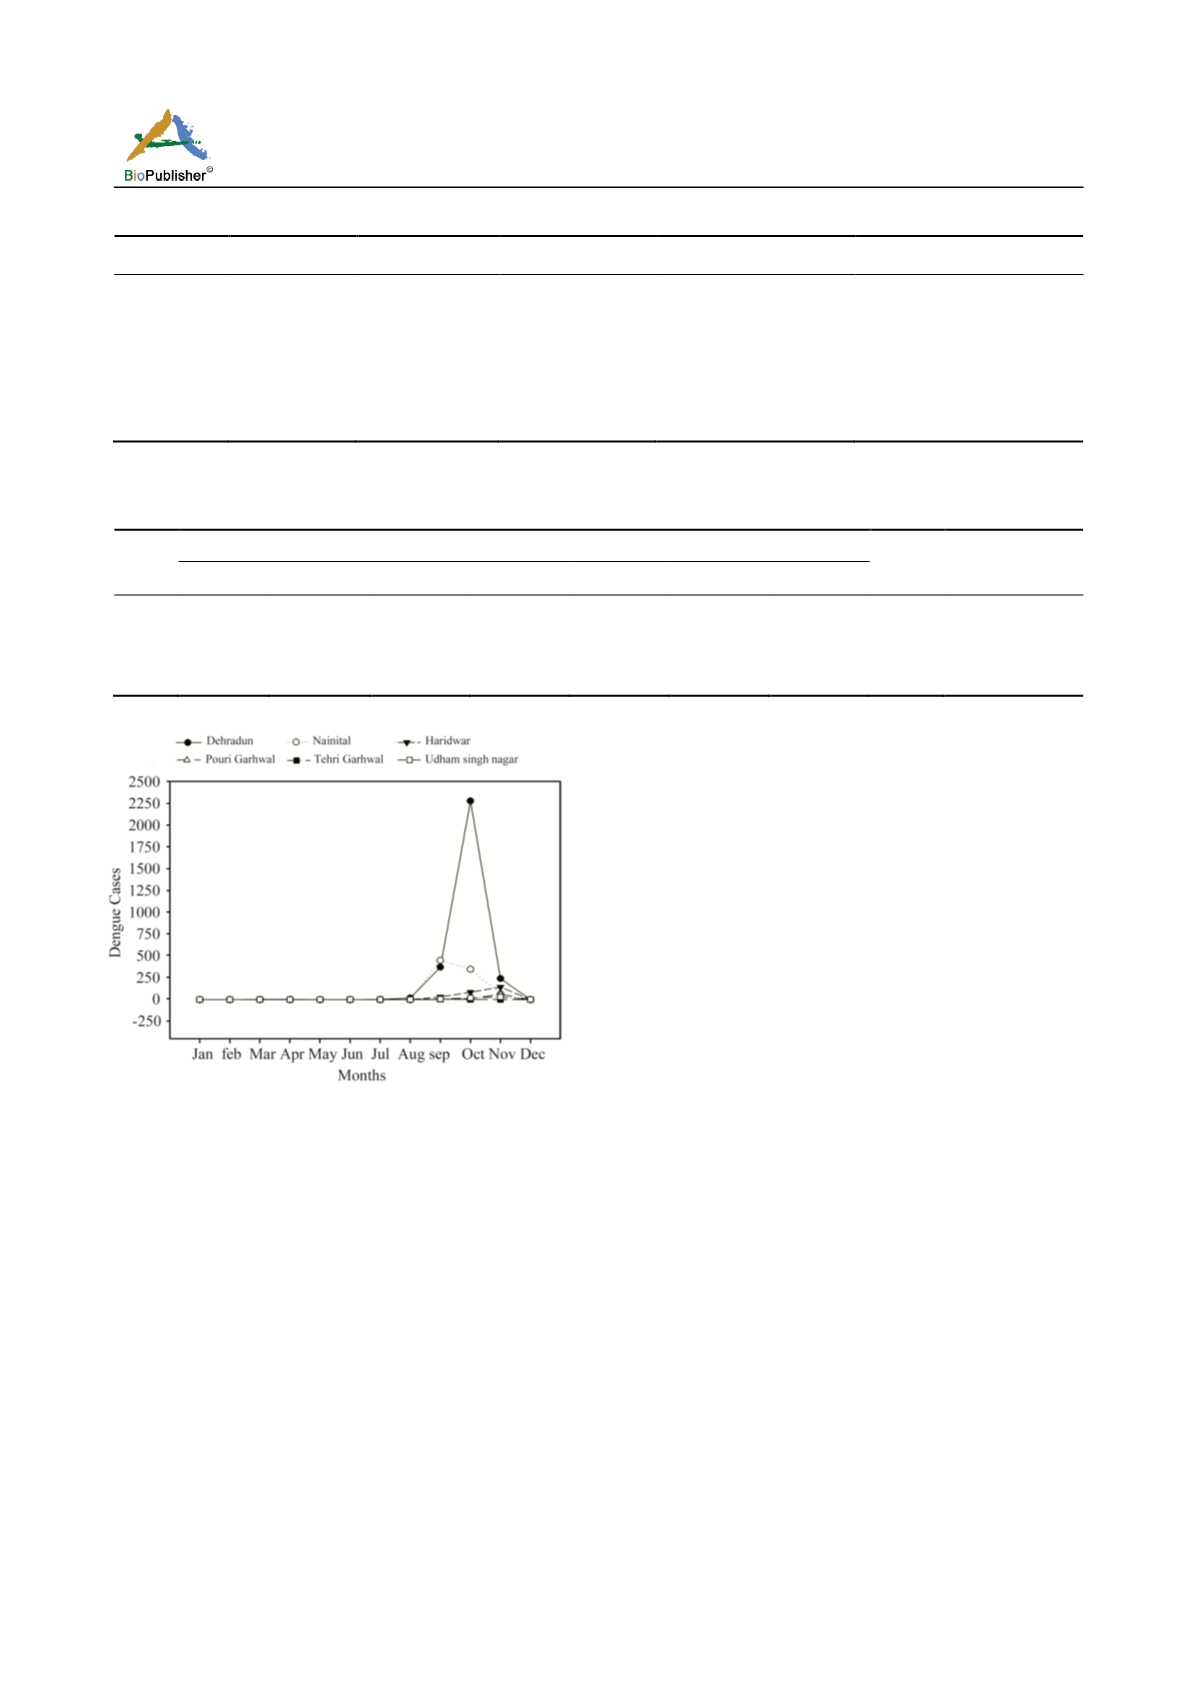
Figure 2 Month wise distribution of dengue cases in
Uttarakhand during epidemics in 2010. The dengue epidemic
rises during late August and continues up to November
at all. The warmest minimum and maximum temperatures
were recorded in June and the lowest in January.
The classical approach of probability shows that
Dehradun is more dengue prone area than Nainital as
77% of cases are recorded from Dehradun, whereas
Nainital registered 23% cases, but large amount of
containers with mosquito breeding were found in
Nainital (Table 3). We determined that 41% and 23%
of total containers surveyed are found positive for
mosquito breeding in Nainital and Dehradun
respectively (Table 3). We classified breeding sites in
seven different types (e.g., tires, coolers, tin-containers,
cement tanks, clay pots, plastic containers, and Fridge
vessels). Among these different containers, tires (95%),
tin containers (51%), cement tanks (44%), and plastic
containers (41%) show the maximum potential for
breeding in Nainital, whereas, in the Dehradun
maximum breeding of
Aedes
mosquitoes were found
in fridge vessels (43%) followed by coolers (27%),
plastic containers (25%) and cement tanks (23%)
(Table 3). Distribution of seven types of positive
containers in different surveyed localities is
summarized in Table 4 and Table 5 for Nainital and
Dehradun respectively. In terms of mosquito breeding
in different localities, Khatyari, Gular Ghati and
Forest compound in Nainital, on the other hand,
Reetha Mandi and Deep Nagar in Dehradun are the
high alert areas (Table 4 and Table 5).
We calculated that the overall mean values of all
entomological indices are relatively higher in Nainital
(HI = 32.33, CI = 25.92 and BI = 124.99) than
Dehradun (HI = 28.68, CI = 17.93 and BI = 77.33)
(Table 6). Distribution of these indices in different
localities is presented in Figure 4. A pairwise
comparison of these indices (HI, CI, and BI) with
Mann-Whitney U nonparametric test reveals that the
observed ranking difference of these indices in Nainital
and Dehradun is not statistically significant (p>0.05).


