Journal of Mosquito Research 2015, Vol.5, No.17, 1-10
7
Table 5 Percentage distribution of positive container and influence of types of containers for breeding of
Aedes
mosquitoes at
different localities surveyed in Dehradun
Areas/Localities
Case (%) = 77%
Chances to be getting
Aedes
Larvae/pupae in different types of containers
Tires
Coolers
Tin containers Cement tanks
Clay pots
Plastic
containers
Fridge
Total
Patel nagar
46%
0%
0%
41%
25%
12%
40%
26%
Vikas Nagar
0%
0%
0%
4%
3%
2%
0%
3%
Chandreshwar Nagar
25%
0%
0%
0%
17%
7%
14%
12%
Kailash gate
0%
0%
0%
0%
0%
0%
0%
0%
Shyampur
0%
0%
0%
0%
16%
14%
0%
14%
Aadarsh gram
0%
0%
0%
0%
26%
20%
0%
23%
Rani Pokhari
0%
0%
0%
0%
16%
10%
0%
14%
Reetha Mandi
0%
50%
0%
0%
52%
0%
74%
61%
Deep Nagar
0%
8%
0%
25%
7%
70%
29%
44%
Kedar Purum
10%
0%
0%
0%
13%
0%
37%
17%
Indra colony
0%
0%
0%
0%
0%
3%
0%
2%
Dehradun Total
20%
27%
0%
23%
19%
25%
43%
23%
Variance = 3%, 3 Sigma limit = 32%
Table indicates high-risk containers in terms of
Aedes
breeding; Digits in bold font highlight the highest percentage of containers
found positive for
Aedes breeding
in a given localities.
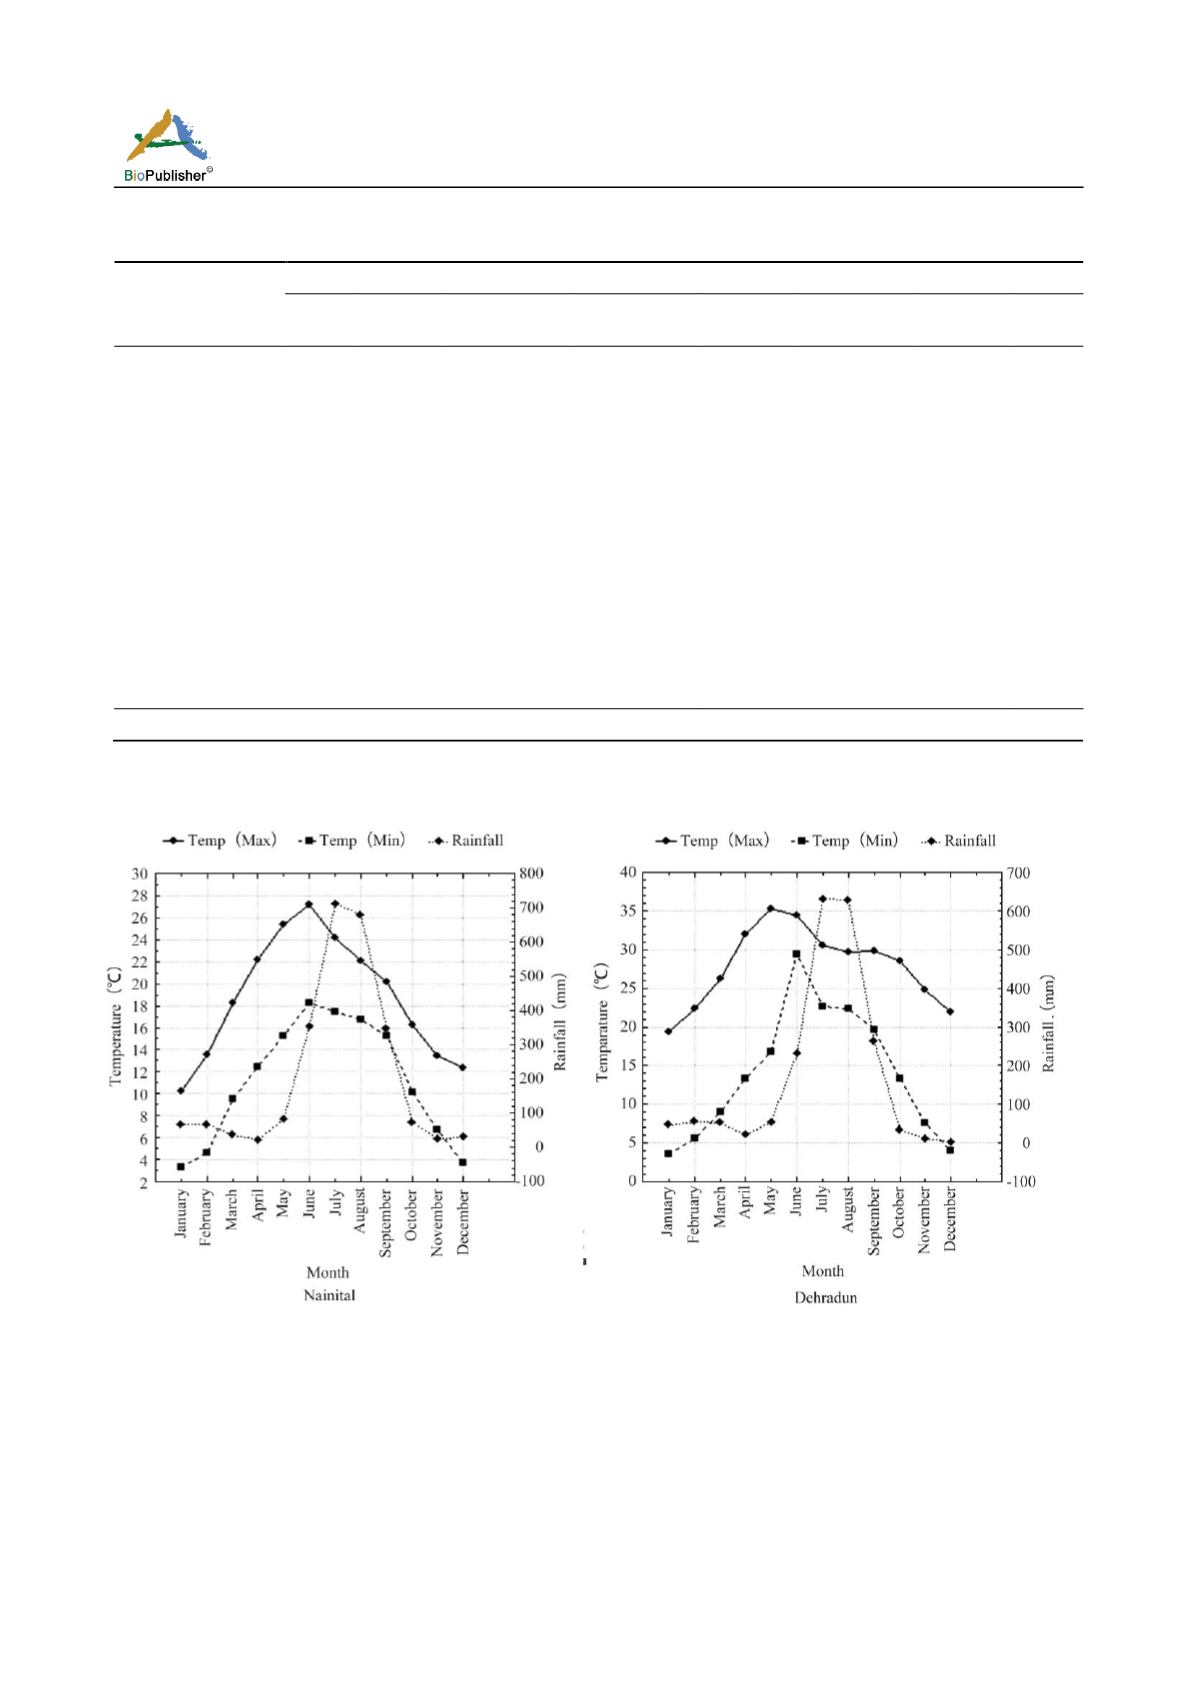
Figure 3 Summary of weather data from Nainital and Dehradun districts of Uttarakhand. Temperature (°C) and rainfall (mm) data
based on mean of the last 25 years (monthly arithmetic averages).
resulted in a huge expansion of dengue vectors in
urban as well as rural habitats (Tauil 2002; Barcellos
et al
.
2005; Medronho et al
.
2009).
Here, we should acknowledge that technically the present
study might have few missing values and limitations.
The existence of detailed entomological surveillance
data before, during, and after the dengue epidemic in
study sites may offer a unique opportunity to analyze
cause and effect relationship. The entomological
data collection has been limited to


