Journal of Mosquito Research 2015, Vol.5, No.17, 1-10
4
test was aimed to verify whether the ranks of variables
(HI, CI & BI) co-vary. The entomological indices
from Nainital and Dehradun districts were transformed to
approximately normal distribution (by using square
root transformation) for calculating means, standard
deviation (SD), and 95% confidence intervals (CI).
After performing the descriptive statistical test on a
transformed variable, we have back-transformed the
outcome statistics (mean, SD and 95% CI) into a
count by squaring it to get a feel for the precision of
the magnitude. Statistical comparisons in the
distribution of entomological indices (HI, CI, & BI) in
Nainital and Dehradun districts were made by performing
pair-wise comparisons with Mann-Whitney U non
-parametric test. This statistical test was aimed to
verify whether the ranks of variables (HI, CI & BI) are
same in these two districts and the differences we
observed are just coincidence.
Results
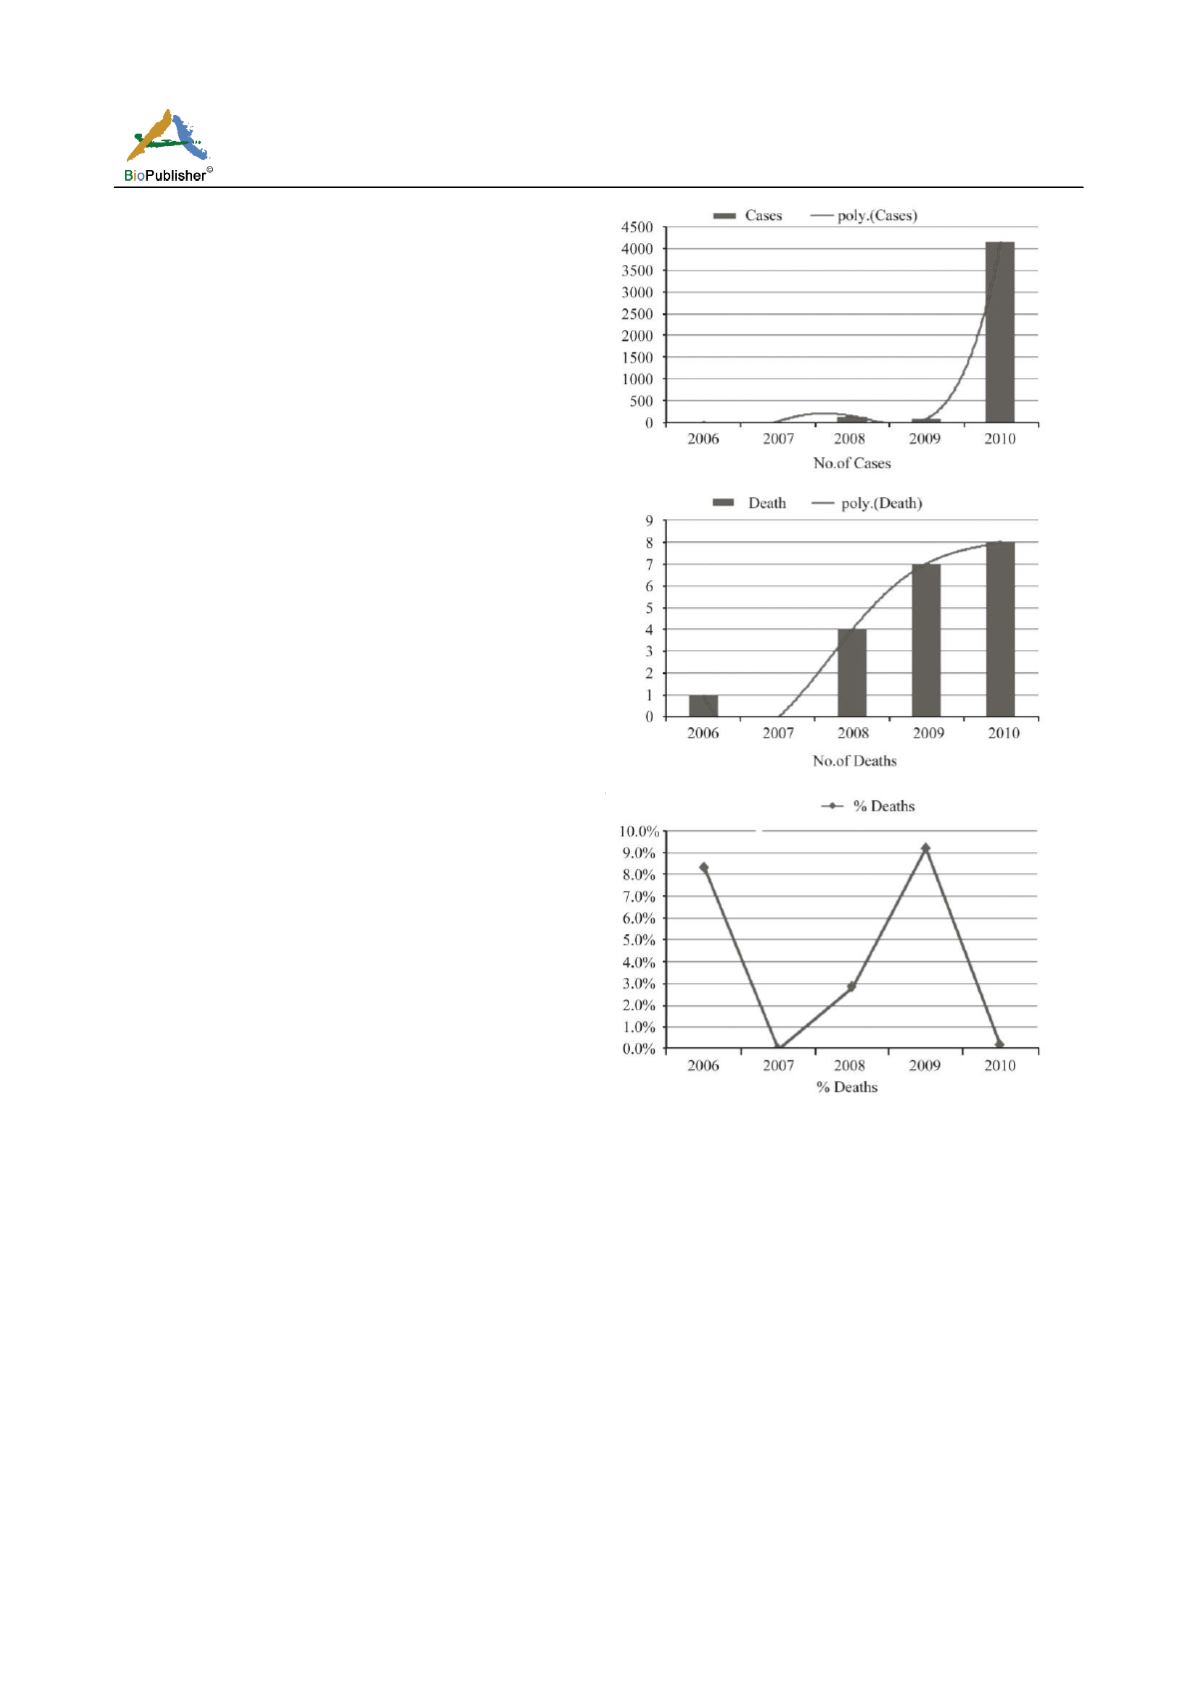
The history of dengue epidemics in last five years
(2006 to 2010) in Uttarakhand is presented in Table 1
and Figure 1, which show an epidemic of dengue
during 2010 with total 4140 laboratory-confirmed
dengue cases, which means about 5347% increase of
dengue cases (Table 1). We observed that both numbers
of dengue cases and numbers of deaths due to dengue
are gradually increasing from 2006 to 2010. However,
percentage death rates due to dengue exhibit a
fluctuating trend (Table 1), although, Figure 1
shows
the direction towards the actual flow of dengue
epidemics in Uttarakhand during the past few years.
During the 2010 epidemic, our survey revealed that
out of six dengue prone districts of Uttarakhand state,
Nainital (862 cases) and Dehradun (2913 cases) were
the worst dengue affected districts during the
epidemics followed by Haridwar (257 cases), Pouri
Garwal (73 cases), Udham Singh Nagar (55 cases) and
Tehri Garwal (04 cases) (Figure 2). Total 3775
laboratory-confirmed dengue cases were registered
from Nainital and Dehradun districts in 2010, an
incidence rate of 142.5 per 100000 populations (Table
2). It shows about 91.19% of total dengue cases in
Uttarakhand were reported from these two districts.
Table 2 summarizes the age and sex-specific distribution
of dengue cases in Nainital and Dehradun (combined)
during 2010. The incidence rate in male (169.9 per
100000) is significantly higher than in female (112.3
Figure 1 Dengue cases and deaths in Uttarakhand (India)
during last five years. Both the number of cases and death has
been increased during last five years. However, the percentage
of deaths has decreased.
per 100000). Dengue cases are predominant in the age
group 21-30 years (Table 2).
Monthly weather data in Nainital and Dehradun districts
(Figure 3) shows that temperature variation during the
year is moderate; Nainital has a relatively colder
climate than Dehradun. However, rainfall variation
throughout the year is great. Although the rainy season
begins each year in late May or early June, most
rainfall occurs in July and August and gradually
decreases in September and October. February and
November–January was dry, with very little or no rain


