Bt Research, 2015, Vol.6, No.8, 1-15
5
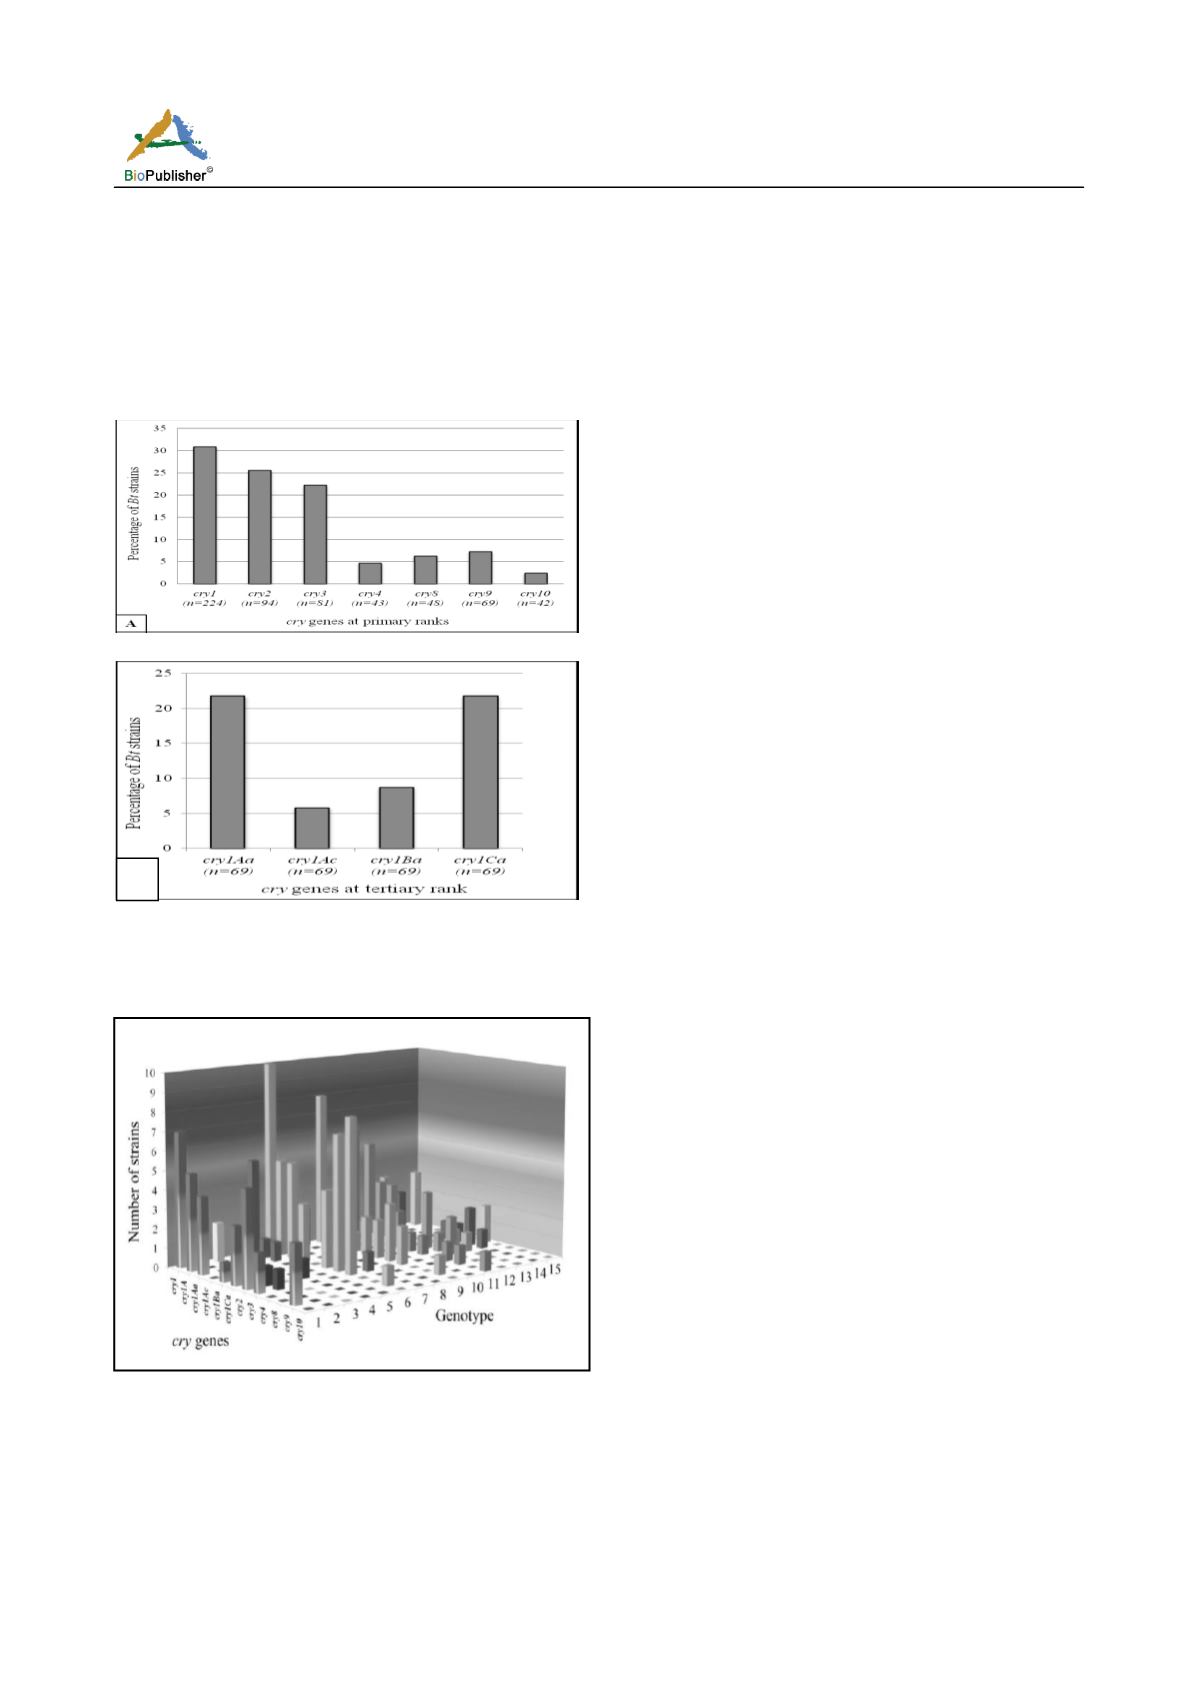
tertiary subgroups of
cry1
gene (
cry1Aa, cry1Ac,
cry1Ba, cry1Ca
belonging
to
cry1
as it was the most
prevalent) were also detected (Fig 2A- sup, 2B- sup,
2C- sup and 2D- sup) and their prevalence was
determined where
cry1Aa
and
cry1Ca
were found to
be the most prevalent (Fig 4B).
Fig.4 Prevalence of different
cry
genes in the indigenous
Bt
strains (n: Number of organisms). A) Primary subgroups, B)
Tertiary subgroups.
Fig.5 Distribution of different
cry
genes in the different
genotypes those were established in this study by RAPD-PCR
method. Prevalence of different genes in each genotype is
indicated with same colored column i.e. color varied with
genotypes not genes.
1.4 Pattern of
cry
genes distribution within
RAPD-genotyes
As the genotypes and
cry
gene profiles of the strains
were thus retrieved, it was analyzed whether the
distribution of
cry
genes was random or genotype
oriented. So, the distribution of different
cry
genes in
different genotypes was analyzed and from the
graphical presentation (Fig 5) it was revealed that
cry
genes were present in all genotypes except genotype
10. The abundance of these
cry
genes were maximum
in genotypes 1, 6, 9, 11 and 12. Though genotypes 9
and 11 were found to be the largest containing more
than 25% of the strains, only genotype 9 of them was
significant with different
cry
genes besides genotypes
1 and 6 as compared to the number of strains.
Comparing the ratio between the number of
cry
genes
and strains in the genotypes, genotype 6 (2.167) was
found to be most significant followed by genotype 1
(1.285), genotype 9 (0.29), genotype 11 (0.18) and
genotype 3 (0.14). On the other hand, maximum 6
types of
cry
genes were present in genotypes 1, 6, 9
and 11. Thus, it was clear from this analysis that
though the
cry
genes were observed in varied
frequencies in most of the genotypes,
cry
genes were
found to be most abundant in terms of number and
type in genotype 6, 1 and 9. Again, the presence of
same
cry
gene in different genotypes increased the
chances that the degree and spectrum of toxicity might
be variable i.e. genes except
cry4
,
cry8
and
cry10
were found to be present in multiple genotypes.
1.5 Comparison between different similarity
parameters
Another comparison was performed with 20
Bt
strains
(indigenous- 19, reference- 1) in terms of their 16S
rRNA gene sequence based phylogeny (Shishir et al.,
2014), Biotype, RAPD based genotype and number of
available
cry
genes (Fig 6) which revealed that
phylogenetically close strains were similar in biochemical
properties. Phylogenetically close 12 strains as in
sub-cluster A1 were observed to have similar biochemical
properties since from same biotype kurstaki except
strain DSf3 (non-hemolytic), strain CiSa5 (biotype ten)
and KSa2 (
dendrolimus
). Again in sub-cluster A2, 3
strains out of 5 were non- hemolytic and 2 out of 3
strains in cluster B were from biotype kurstaki.
Though the biochemical properties of most of them
B


