Bt Research, 2015, Vol.6, No.8, 1-15
4
genotype throughout the whole study. Thus the height
of any clade (cluster) exceeding 0.2 (Fig 1-sup) was
considered as separate genotype. RAPD pattern of
Bt
strains representing these 15 genotypes are as shown
in Figure 1. This enabled quantitative comparison of
genetic diversities among different sets of strains e.g.
biotypes or locations upon standardization.
The
Bt
strains were found to be divided into two
major clusters, A and B in the dendrogram (Fig 1-
sup). Cluster B was smaller comprising of only
14 strains and A was larger with 163 strains, hence
subdivided further into subclusters A1 and A2.
Sub-cluster A2 was large enough and found to be
further branched into clusters with significant number
of strains denoted as A2a and A2b.
Genotype 2, 4 and 10 were simplicifolious (single
leafed), genotype 14 was bifolious (two leaved),
genotype 8 and 15 were trifolious (three leaved) and
rest others were polyfolious (more than three leaved).
The genotypes were observed to contain the strains in
a mingling manner with respect to their biotypes
except genotype 12 which contained 80% of strains
from biotype kurstaki. And for the locations, strains
from the same location appeared to be closely related
even though their biochemical characteristics differed
(Fig 1- sup).
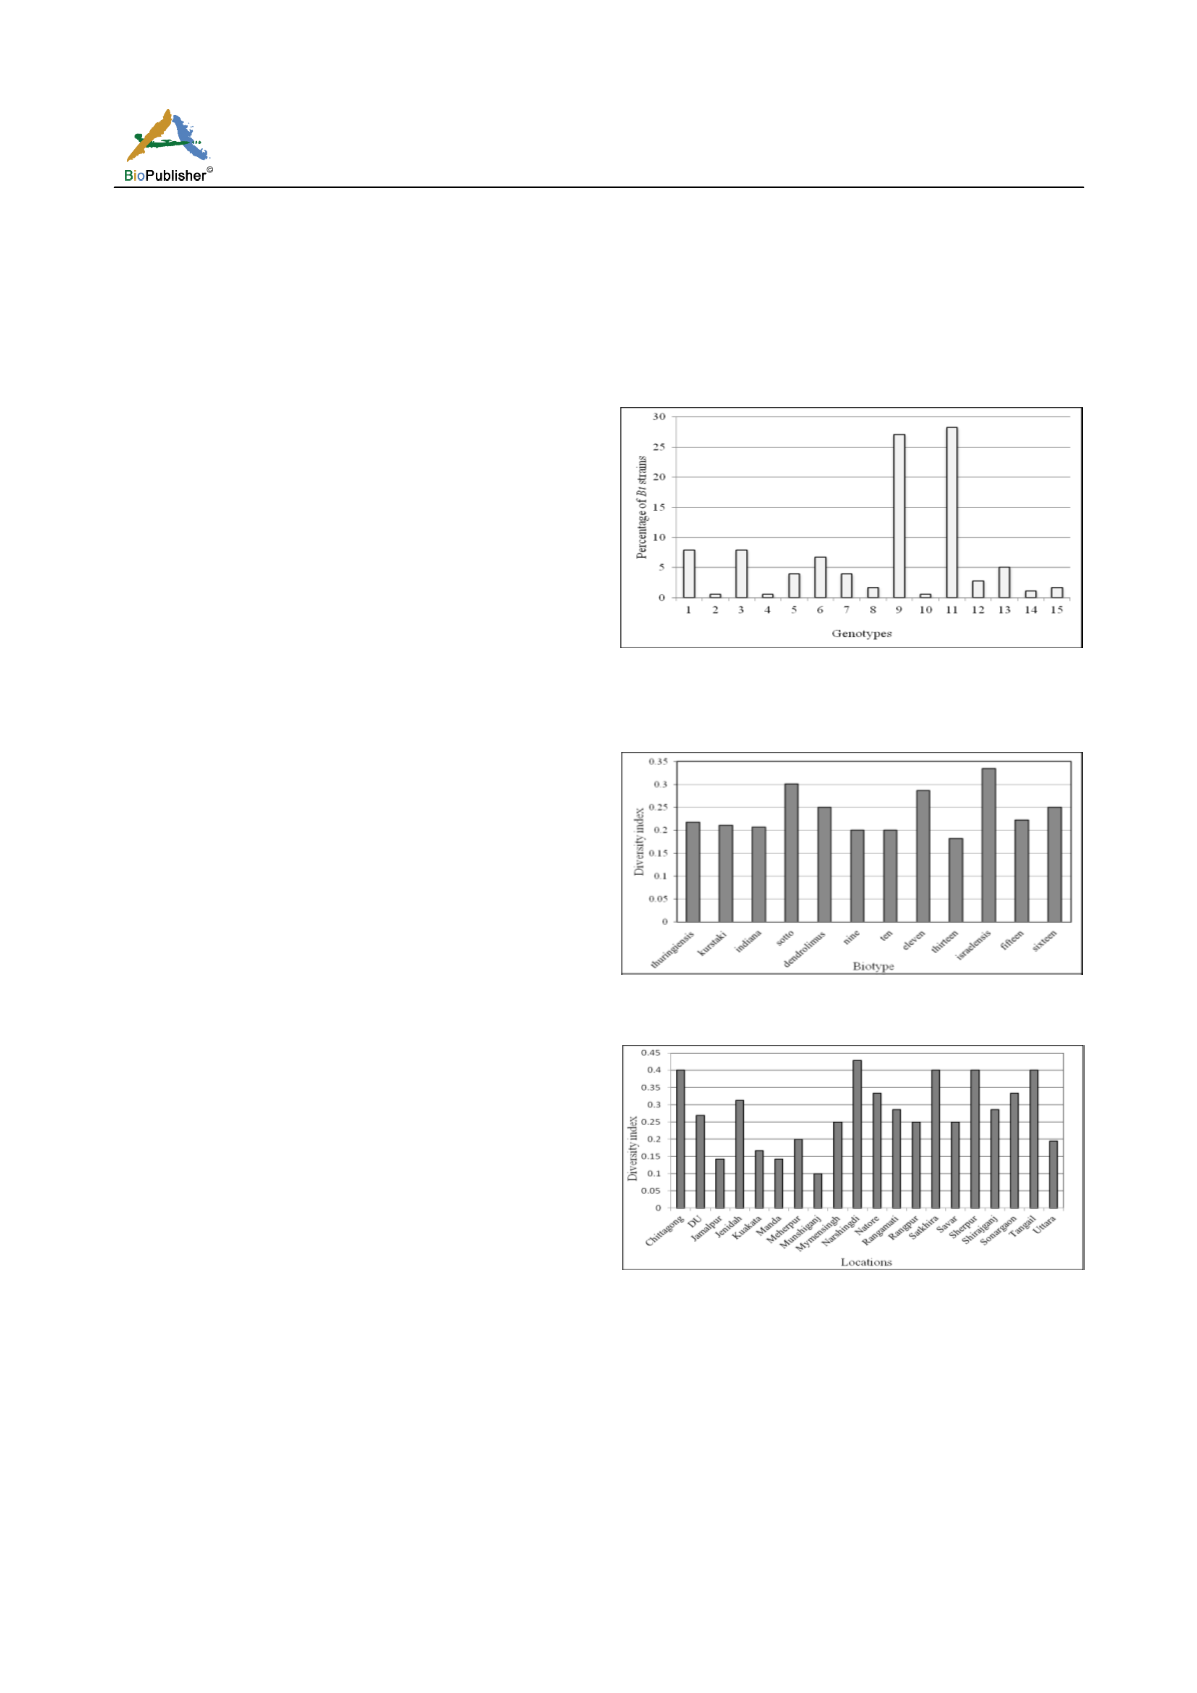
The prevalence of
Bt
strains in different genotype was
also calculated and genotype 9 and 11 were found to
be the largest, each containing more than 25% of the
strains (Fig 2).
1.2 Comparison of diversity between biotypes and
locations
Based on the threshold height or distance of the clades
in the scale bar, the diversity indices (DI) were
calculated as the ratio between the number of major
clusters and the number of strains, within biotypes and
locations. In case of biotypes, genetic diversity was
maximum in
Bt
israelensis followed by sotto, eleven
and minimum was in biotype 13, ten and nine (Fig
3A). In case of locations, maximum diversity was
observed among the strains of Narshingdi and the
minimum was for Munshigonj (Fig 3B).
The average diversity index for locations (0.27±0.098)
was higher than that for biotypes (0.23±0.046) which
indicates that the genetic diversity among the strains
of a certain location is not resulted from the influence
of abiotic factors only such as UV, salinity, trace
elements, pH, organic maters etc rather a phenotypical
pattern was found to be maintained as the DI among
the strains with similar biochemical properties was
found to be lower across different locations.
Fig 2 Prevalence of different genotypes among the indigenous
Bacillus thuringiensis
strains of Bangladesh.
Fig. 3 Comparison of diversity indices (DI) as calculated based
on the ratio of number of genotypic clusters beyond the
threshold level and number of strains for A) the selected
biotypes B) the selected locations.
1.3 Prevalence of
cry
genes
Detection of major
cry
genes (
viz. cry1, cry2, cry3,
cry4, cry8, cry9, cry10
and
cry11
) in the indigenous
Bt
strains was reported earlier (Shishir et al., 2014).
Besides the prevalence of primary subgroups (Fig 4A),
A
B


